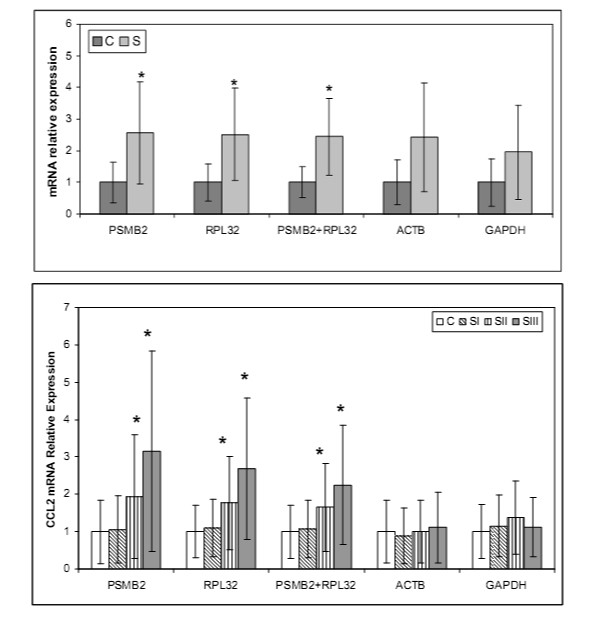
Figure 5.
Comparison between the relative mRNA expression (ratio target gene/reference gene) of INFG gene (the upper part) and CCL2 gene (the lower part) in unseparated bronchoalveolar cells of sarcoidosis patients (S, n = 63) and control subjects (C, n = 17) from the 2nd cohort using newly validated (PSMB2/RPL32) and "traditional" reference genes (ACTB/GAPDH) as denominators. The data are presented as a mean fold change of relative expression compared to control subjects (normalized to 1); the whiskers on each box represent the SD values. For details see Methods section Gene expression measurements by qRT-PCR. *p < 0.05.

