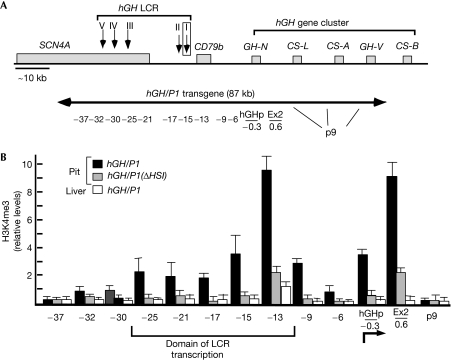
Figure 1.
H3K4me3 modifications that are both pituitary specific and HSI dependent encompass the hGH LCR and hGH-N. (A) Diagram of 100 kb of the human genome on chromosome 17q22 encompassing the hGH locus and the hGH/P1 transgene. The region shown contains the five genes of the hGH cluster, the B-lymphocyte-expressed CD79b gene and the striated muscle-specific gene SCN4A (grey rectangles). All genes are transcribed in the same orientation (from left to right). The five DNase I HS that constitute the hGH LCR are indicated by downward arrows. The extent of the 87 kb hGH/P1 transgene is shown below by the double-headed arrow. The positions of the 13 PCR amplimers used to survey the locus for H3K4me3 modification enrichment are indicated below the arrow as coordinates (kb) relative to the start site of hGH-N transcription. The 99 bp deletion in the hGH/P1(ΔHSI) transgene that removes two of the three pituitary Pit-1 binding sites is denoted by the boxed HSI. Note that the ‘HSI' amplimer (−15) used in these studies detects sequences that are adjacent to this deleted segment in the hGH/P1(ΔHSI) transgene. The p9 amplimer corresponds to a conserved sequence located 5′ to each of the four placentally expressed genes in the cluster. (B) H3K4me3 modifications in mouse transgenic pituitary (Pit) and liver chromatin and in the absence of HSI. The chromatin immunoprecipitation antibody was specific to the H3K4me3 modification. Each bar represents the mean±s.d. of four independent assays of the indicated chromatin samples: hGH/P1 pituitary chromatin (black bars), hGH/P1(ΔHSI) pituitary chromatin (grey bars) or hGH/P1 liver chromatin (white bars). Each histogram bar represents the ratio of the DNA amplification signal from Southern blot detected in the immunoprecipitated sample to that in the corresponding input sample. Each ratio was normalized to the corresponding ratio for a DNA segment within the endogenous skeletal muscle-specific mMyoD gene (Weintraub et al, 1991; Sawado et al, 2003). Each ratio, after normalization to mMyoD, is expressed on the Y axis in arbitrary units. The amplimer set corresponding to each set of bars is noted below the X axis. The site of hGH-N transcription initiation is noted below the X axis (angled arrow) and the previously defined ‘LCR domain of transcription' is indicated by the labeled bracket below the histogram. All comparisons between hGH/P1 modifications in the pituitary compared with liver are significant (P<0.001) except at −37 and p9. Comparisons between hGH/P1 and hGH/P1ΔHSI between −25 and Ex2 inclusive are significant (P<0.001). Comparisons between hGHΔHSI pituitary and hGH/P1 liver are significant only at Ex2 (P<0.01). H3K4me3, histone H3 lysine 4 trimethylation; hGH, human growth hormone; LCR, locus control region.

