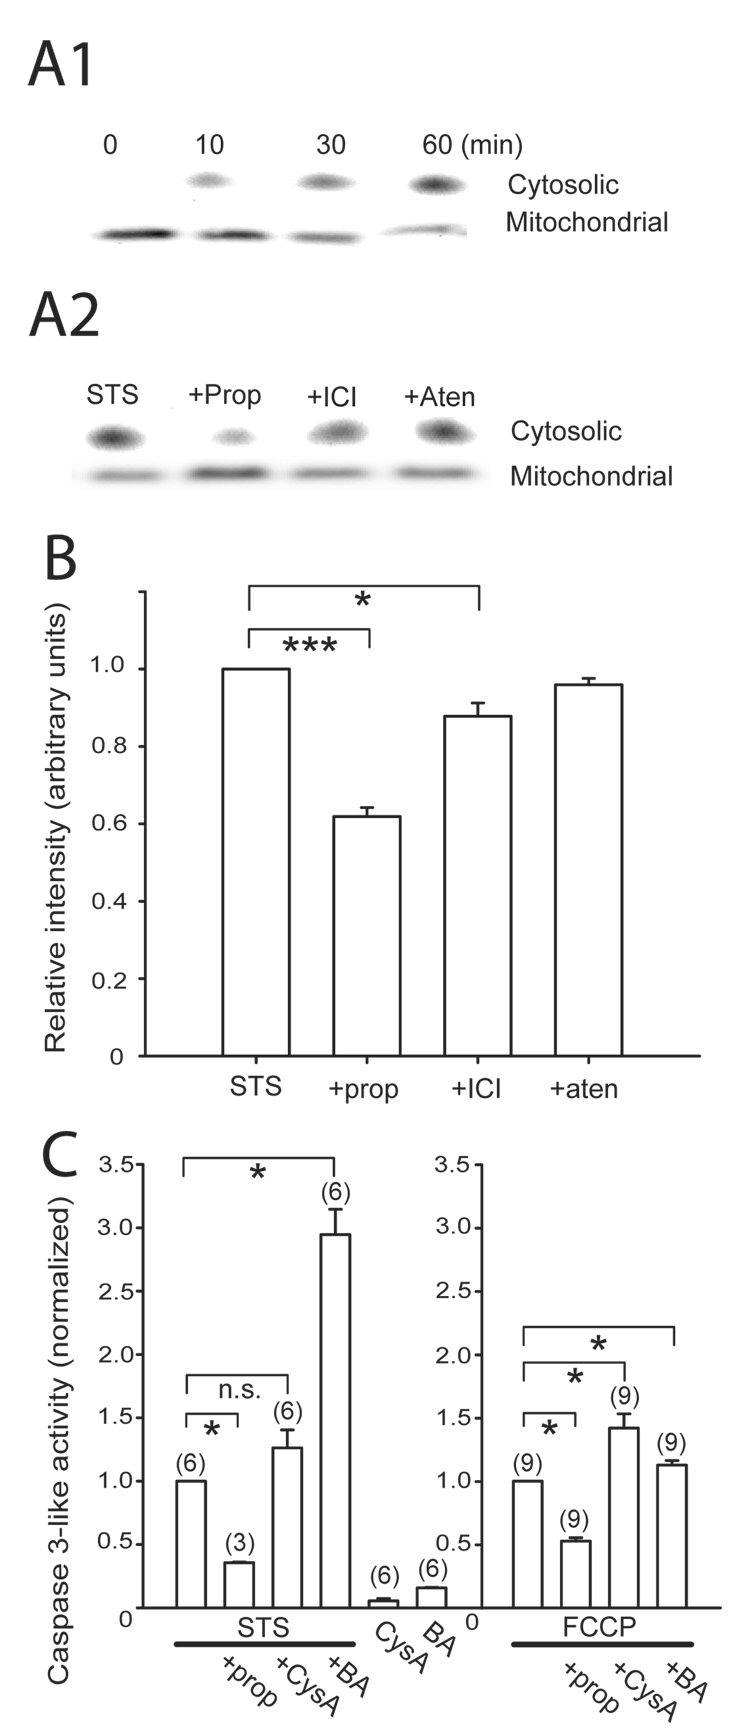
Fig. 6. Cytochrome c release from mitochondria induced by staurosporine was blocked by propranolol.
A. Time-dependent increase in cytosolic- and a reciprocal decrease in the mitochondrial- cytochrome c induced by 10 µM staurosporine (A1) and the effect of β-adrenoceptor blockers on this release at 60 min (A2). The concentration of the drugs were staurosporine (STS) 10 µM, propranolol (prop) 100 µM, ICI 118551 (ICI) 10 µM, and atenolol (aten) 100 µM. The cytosolic and mitochondrial cytochrome c appeared differently on the Western blot due to the different extraction buffers used for the two cellular fractions (see Methods). B. A bar plot of densitometric quantification of immunoblots of cytosolic cytochrome c normalized to the STS only condition from four separate experiments. The relative intensities (in arbitrary units) of propranolol-treated (0.62 ± 0.02) and ICI 118551–treated (0.88 ± 0.03) samples were significantly reduced from staurosporine alone while atenolol had no effect (0.96 ± 0.02). C. Propranolol inhibited both STS- and FCCP-induced caspase 3-like activation that was not blocked by 2 µM cyclosporin A (CysA) or 10 µM bongkrekic acid (BA). The relative caspase 3-like activity was normalized to the STS-only (left) or p-trifluoromethoxy-carbonyl-cyanide-phenyl-hydrazone (FCCP)-only conditions (right). Statistical significance at * P<0.05 and *** P<0.001. n.s. = not significant. Number of independent measurements in parentheses.

