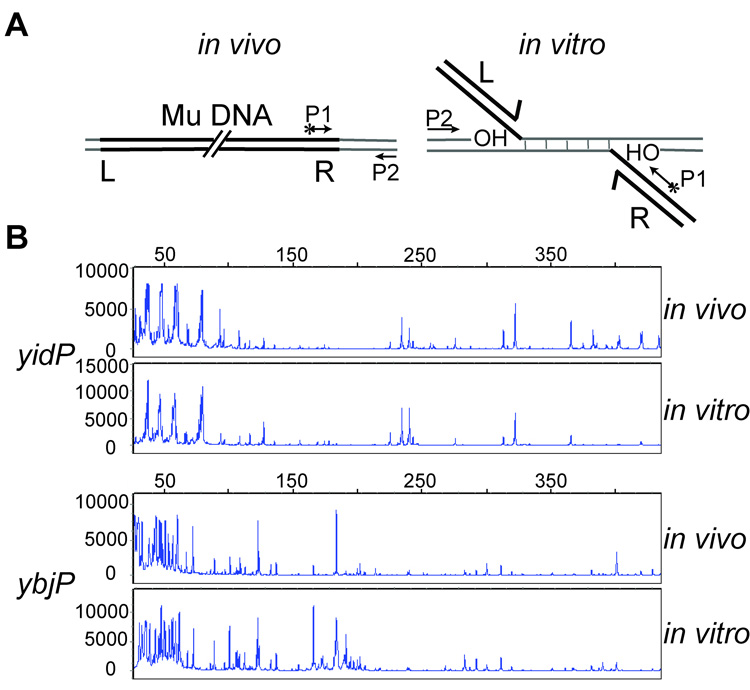
Figure 3. In vivo and in vitro patterns of Mu integration on two hot targets.
A. PCR strategy for amplification of in vivo insertion sites packaged in Mu phage (left), or in vitro insertion sites from strand transfer products generated as described in Fig. 2C. (right). Fluorescently labeled (*) P1 primer hybridizes within the Mu R end, and P2 hybridizes to one end of the gene being analyzed. B. PCR products from yidP and ybjP reactions were subjected to Fragment Length Analysis as described in Methods. Numbers on the X-axis refer to nucleotides. The intensity of the fluorescent signal is represented by arbitrary numbers on the Y axis.

