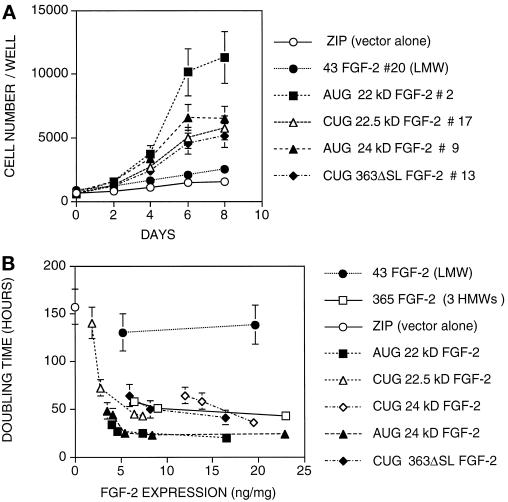
Figure 4.
Growth of cells expressing HMW FGF-2 forms. (A) Examples of growth curves in 1% serum of cells expressing individual HMW-FGF-2 forms or an amino-terminal deletion mutant. Cells were plated in 96-well plates at 1000 cells/well; after 24 h the medium was replaced with 1% serum (day 0). At the time points indicated, cells were fixed and stained with 0.1% crystal violet solution (Kueng et al., 1989) as described in MATERIALS AND METHODS. Cell number was calculated from a calibration curve (cell number/OD 600 nm) done under the same conditions. (B) Graph showing the relation between FGF-2 expression in NIH 3T3 clones and doubling time in 1% serum. Each point represents the doubling time and FGF-2 expression level of a distinct clone of the type indicated. Doubling times were calculated from growth curves in 1% serum over 6 d.

