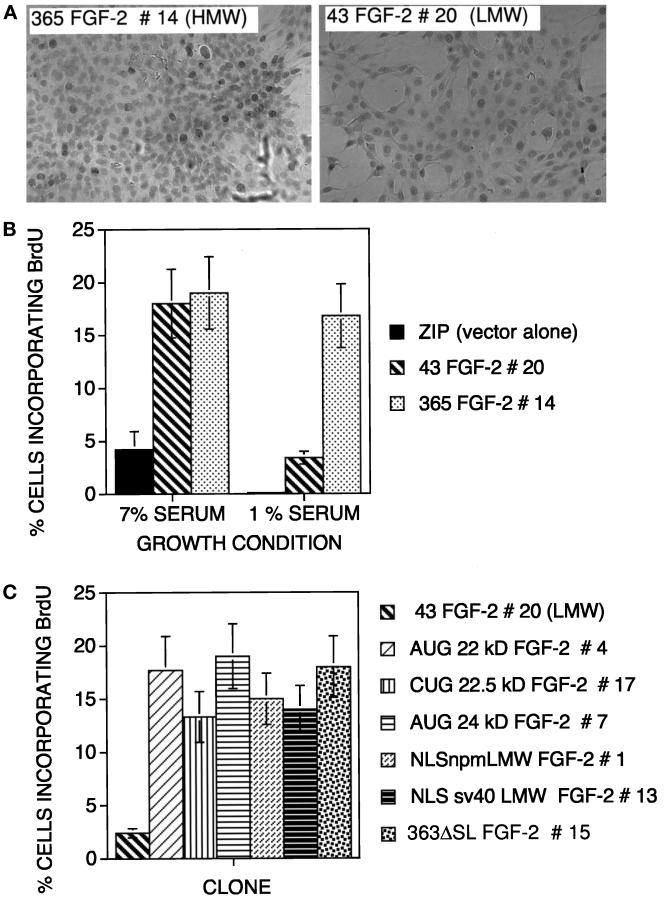
Figure 9.
DNA synthesis in clones expressing cytoplasmic or nuclear FGF-2 forms. (A) BrdU staining of LMW or HMW FGF-2 expressing cells after 4 d in 1% serum. Nuclei that have incorporated BrdU (2.5 h, 4 mg/ml) appear brown among a population of blue nuclei. Original magnification, 200×. (B) Histograms presenting the percentage of nuclei incorporating BrdU in the cell populations in complete or serum-depleted media for cells from vector alone, LMW, or HMW FGF-2–expressing clones. (C) Data from a similar experiment performed with cells expressing LMW or different nuclear FGF-2 forms kept in 1% serum for 4 d. Three fields of at least 300 cells each were counted for each sample. Data represent the mean ± SD from triplicate samples.

