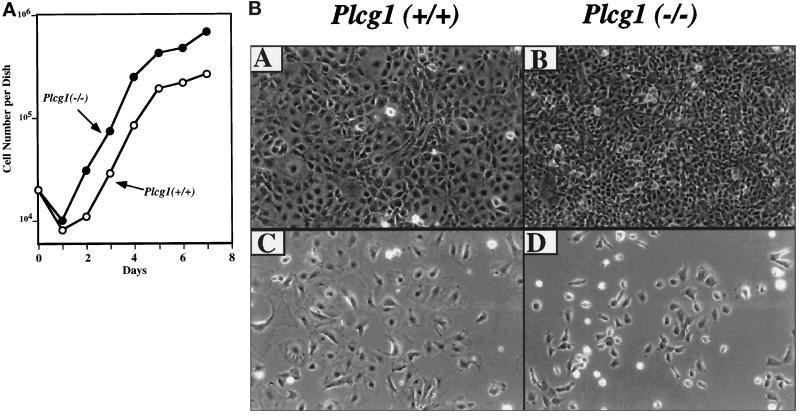
Figure 1.
Growth and morphology of Plcg1+/+ and Plcg1−/− embryonic fibroblasts. (A) Cells were seeded at an initial density of 2 × 10³ cells per cm2 in DMEM plus 10% fetal bovine serum. Thereafter cells were counted at the indicated times. Each point represents the average of duplicate cultures. (B) Cells were plated at a low density in DMEM plus 10% fetal bovine serum. When the cells were sparse (C and D) or postconfluent (A and B) photographs were taken (180 × total magnification).

