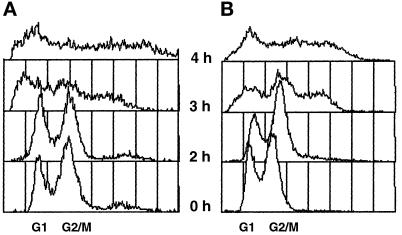
Figure 3.
The mps1 mutant strains undergo aberrant mitosis, producing cells with increased ploidy. (A) mps1–6 cells (AS181–2b; Table 1) were exposed to the nonpermissive temperature and sampled for flow cytometry at 1-h intervals (2 h-4 h samples are shown). For comparison, a histogram for cells grown at the permissive temperature is shown (0 h). (B) The same experiment was performed with mps1–3796 cells (AS131–2d). Similar results were obtained for the remaining four alleles (our unpublished results). In these histograms, the x-axis is the relative DNA content determined by propidium iodide fluorescence, and the y-axis is the relative number of cells (see MATERIALS AND METHODS). The peaks corresponding to normal G1 and G2-M DNA content are indicated on the x-axis. Each sample represents 5,000 cells.

