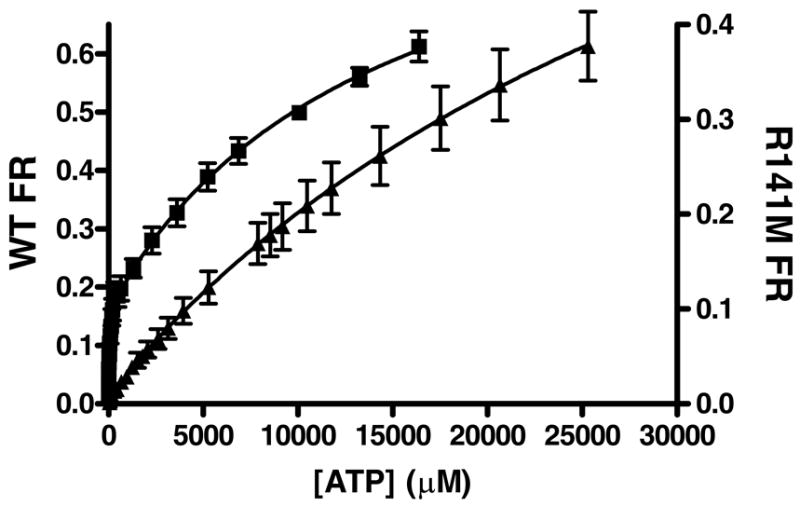
Figure 5. Tryptophan fluorescence quenching of WT and R141M PMK by ATP.

The average fractional response of 3 WT(■) concentrations (0.20 – 0.33 μM) and 3 R141M (▲) concentrations (0.28 – 0.66 μM) is plotted as a function of ATP concentration. All measurements were done at 25°C in 1.7 mL 100 mM Tris-Cl, 100 mM KCl, 1 mM DTT at pH 7.5. The concentration of MgCl2 in these assays was 20 and 31 mM for WT and R141M, respectively. Samples were excited at 295 nm and the emission was monitored between 310 – 450 nm. For data analysis, values measured at the fluorescent emission peak of ~333 nm were corrected for buffer background fluorescence and for dilution. These data were analyzed by nonlinear regression and fit to a 2-site model [y = Bmax1[X]/(Kd1 + [X]) + Bmax2[X]/(Kd2 + [X])] using GraphPad Prism version 4.00 for Windows (GraphPad Software, San Diego California USA, (www.graphpad.com). Error bars represent the standard deviation of the three different protein concentrations.
