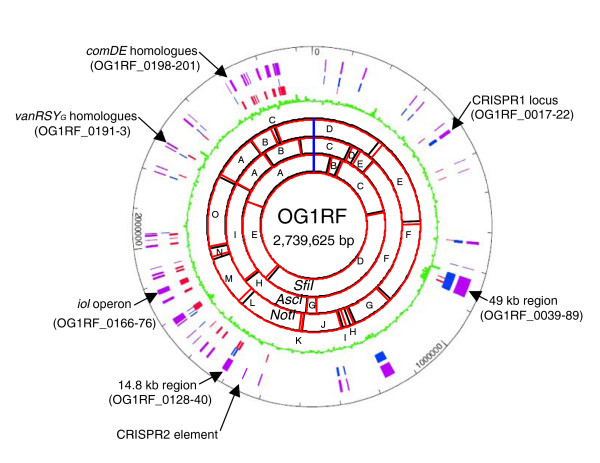
Figure 1.
Map of the OG1RF chromosome. The following features are displayed (from the inside out): restriction maps using SfiI, AscI, and NotI (black) from Murray et al. [10] overlaid with the digestion profile predicted from the sequence (red); G+C content in percentage in green; the total OG1RF-unique genes are shown in purple with those in (+) orientation labeled in blue, and those in (-) orientation labeled in red.

