Figure 1.
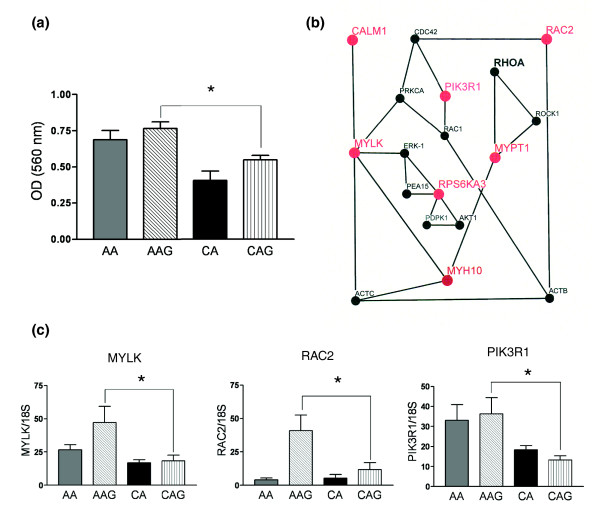
Astrocyte migration and the myosin regulatory network in glaucoma astrocytes. (a) Cell migration assay shows that AA and AAG astrocytes migrate significantly faster than CA and CAG astrocytes. The assay was performed as described in the Materials and methods. Values represent mean optical density (OD) ± standard deviation of triplicate experiments using primary astrocyte cultures of six AA, five AAG, five CA and five CAG donors. Asterisk indicates p-value < 0.05. (b) Schematic representation of the myosin regulatory network. Upregulated mRNAs have large red nodes and font while downregulated mRNAs have large blue nodes and font. Small black nodes and font show genes have 'present calls' without differential expression. (c) Confirmation of three differentially expressed genes from myosin network by qRT-PCR in human ONH astrocytes: MYLK, RAC2 and PIK3R1. Genes were normalized to 18S RNA. Graphical representation of the relative mRNA levels in normal and glaucomatous AA and normal and glaucomatous CA astrocytes (n = 6, two-tailed t-test). Asterisk indicates p < 0.05).

