Figure 2.
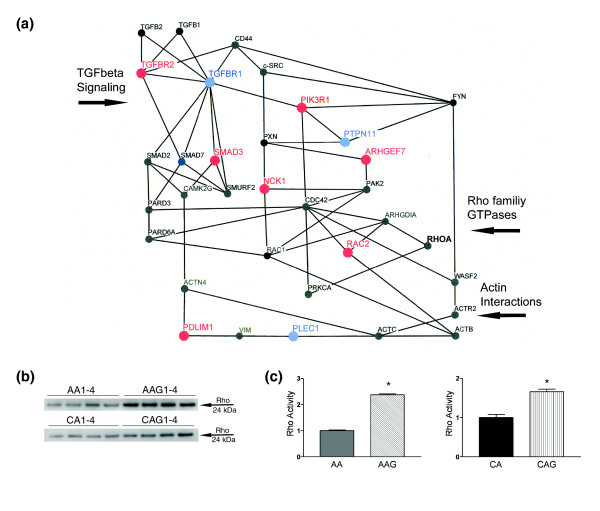
Actin regulatory network and TGFβ signaling in AAG astrocytes. (a) Schematic representation of the actin and TGFβ regulatory network. Upregulated mRNAs have large red nodes and capital font, while downregulated mRNAs are shown with large blue nodes and capital font. Small black nodes and capital font indicate genes that have 'present calls' without differential expression. The RhoA GTPase is in bold in black because of higher activity in glaucoma astrocytes. (b) Representative western blot of the pull-down Rho activation assay demonstrated that both AAG and CAG astrocytes exhibit significantly higher Rho activity than normal astrocytes under unstimulated conditions. (c) Densitometry analysis of the blots from Rho activation assay. Bars show mean fold difference in density ± standard error of two independent experiments. (Asterisk indicates p < 0.05)

