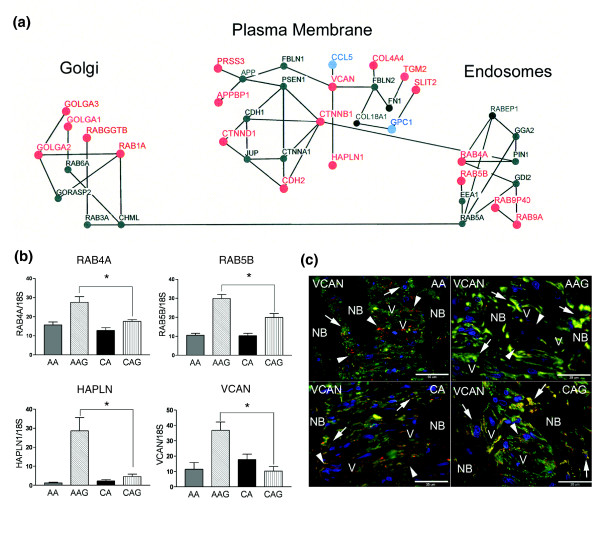
Figure 3.
Intracellular trafficking networks associated with golgi, plasma membrane, and endosomes that have differentially expressed genes in glaucoma astrocytes. (a) Schematic representation of the intracellular trafficking network. Upregulated mRNAs have a large red node and font, while downregulated genes have a large blue node and font. Small black nodes and font indicate genes that have 'present calls' without differential expression. (b) Confirmation of four differentially expressed genes from the trafficking network by qRT-PCR in human ONH astrocytes: RAB4A, RAB5B, HAPLN and VCAN. Genes were normalized to 18S RNA. Graphical representation of the relative mRNA levels in normal and glaucomatous AA and normal and glaucomatous CA astrocytes (n = 6, two-tailed t-test). Asterisk indicates p < 0.05. (c) Representative double immunofluorescent staining of versican (VCAN; red) and astrocyte marker GFAP (green) in sections of human ONH from an AA donor (51 year old female), AAG donor (70 year old male), CA donor (70 year old male) and CAG donor (76 year old male). Nuclei (blue) are stained with DAPI. Note staining of VCAN (red) in the cribriform plates and surrounding the blood vessels (arrowheads). Arrows indicate versican co-localized with GFAP in astrocytes in the cribriform plates of the lamina cribrosa. VCAN staining is stronger in astrocytes of the glaucomatous lamina cribrosa. V, blood vessel; NB, nerve bundle. Scale bar 35 μm.

