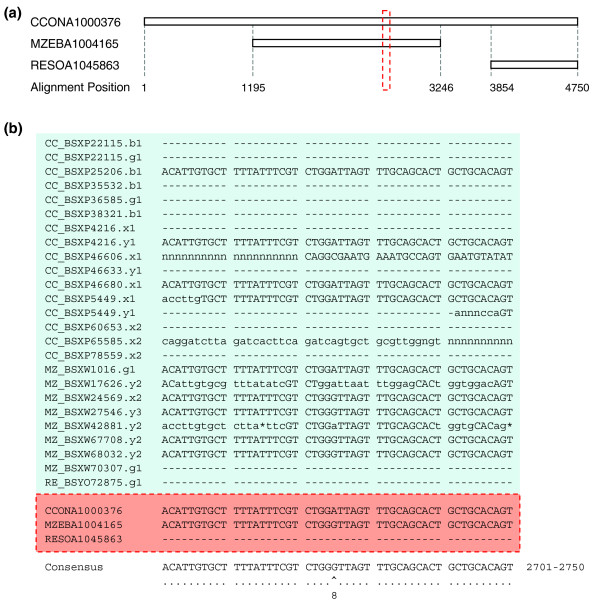
Figure 1.
Alignment of a typical cluster of orthologous sequences. (a) Overall alignment of assembly contigs from three different cichlid species with alignment positions indicated. (b) Expanded detail of nucleotide alignment. Filled pink block shows the expanded alignment corresponding to dotted red box in panel a. Filled blue block shows the alignment of corresponding species' traces that made up the assembly sequences. Lower case nucleotides have base quality scores under 20. Dashes '-' represent sequence unavailability. Asterisks '*' represent gaps inserted into the sequences. Dots '·' represent identity in alignment. Cap '^' represents segregating site. Alignment positions shown after consensus sequence. Polymorphism quality score shown below A-G single nucleotide polymorphism site.

