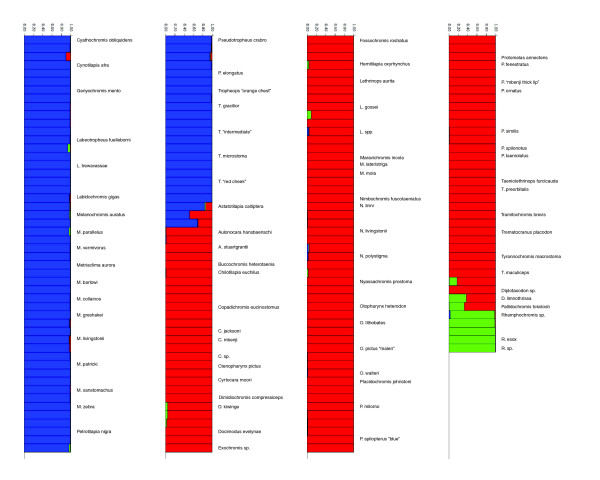
Figure 3.
Bayesian assignment of Lake Malawi cichlids to different evolutionary lineages. We show the contribution to each individual genome (q, which ranges from 0% to 100%) from each of K = 3 predefined genetic clusters (blue, red, and green), for data derived from single nucleotide polymorphisms (SNPs) in Tables 2 and 3. Note that this method predefines the number but not the identity of genetic clusters. Species names are written once; multiple individuals from species are grouped together (for example, four individuals of Pseudotropheus crabro). Species considered mbuna (blue) cluster with other mbuna, to the exclusion of other groups; species thought to represent the earliest divergence within the species flock (Rhamphochromis) clustered together as a separate group (green); and all remaining non-mbuna species formed the third group (red).

