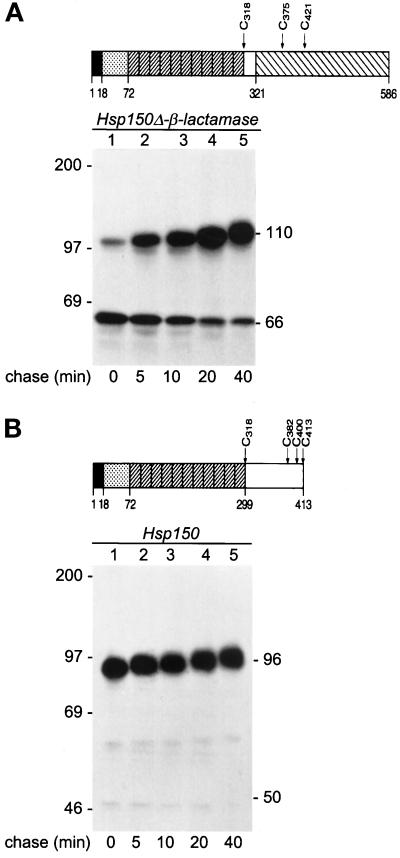
Figure 3.
Kinetics of translocation. Schematic presentations of Hsp150Δ-β-lactamase (A) and Hsp150 (B). Amino acids 1–18, Hsp150 signal peptide. Amino acids 19–72, subunit I of Hsp70. Diagonally striped boxes, 11 tandem repeats of a homologous peptide of subunit II of Hsp70. Amino acids 300–413, unique C-terminal domain of subunit II. Amino acids 322–586, mature β-lactamase. The cysteine residues (C) are indicated. The Hsp150 fragment of amino acids 19–321 contains 96 potential O-glycosylation sites, many of which obtain glycans consisting of 2–5 mannose residues (Jämsäet al., 1995a). H393 cells (A, sec18–1 cells with HSP150Δ-β-lactamase) and H4 cells (B, sec18–1 without the recombinant gene) were preincubated under high cell density conditions at 37°C for 10 min and 35S labeled for 5 min (lane 1), followed by chase in the presence of CHX for the indicated times (lanes 2–5). The lysed cell samples were immunoprecipitated with anti-β-lactamase (A) or anti-Hsp150 (B) antiserum and analyzed by SDS-PAGE and fluorography. The decreasing electrophoretic migration was apparently due to increasing O-glycosylation. Hsp150Δ-β-lactamase (A) and Hsp150 (B) molecules are indicated on the right (kDa), and molecular weight markers on the left.

