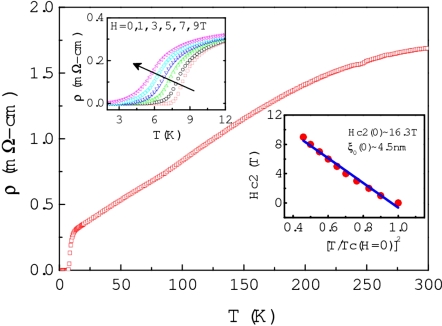
Fig. 3.
Temperature dependence of electrical resistivity (ρ) of FeSe0.88. The Left Inset shows the resistive measurement in magnetic fields (H) of 0, 1, 3, 5, 7, and 9T below 12 K. Tc decreases linearly with increasing magnetic field. The Right Inset displays the temperature dependence of upper critical field (Hc2), with the fit shown in blue.

