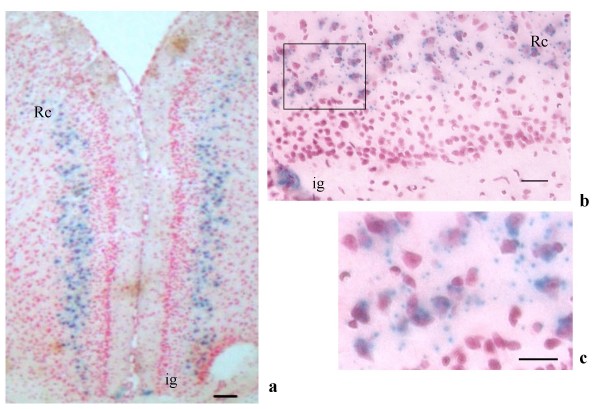
Figure 3.
PTPH1-KO cerebral cortex. a: LacZ detection in retrosplenial cortex (Rc) and indusium griseum (ig) staining (4×, scale bar: 80 μm). b: detail of the Rc and ig (40×, scale bar: 20 μm); c: positive cytoplasmatic staining of the neurons of Rc (63× scale bar: 10 μm); the interneural LacZ signals are due to the presence of trans-sectioned axons and dendrites.

