
Figure 7.
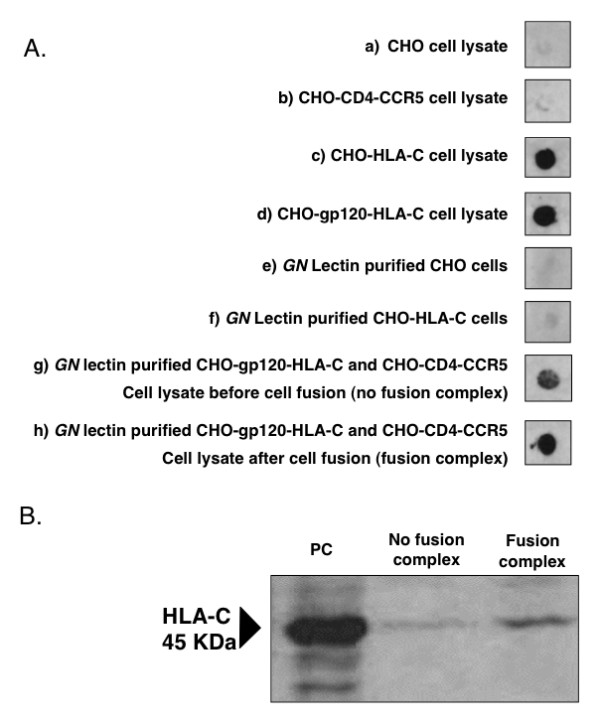
Co-purification of fusion complexes containing HLA-C molecules. Panel A: dot-blot analysis of purified fusion complexes for the presence of HLA-C. Lanes a, b, c and d: cell lysates before purification. Lanes e, f, g and h: cell lysates purified on Galanthus nivalis (GN) lectin columns. Panel B: western blot analysis to detect the presence of HLA-C in purified fusion complexes. Cells were treated with DTSSP, which fixes only proteins present on the cell membrane, and lysates purified on GN lectin columns. PC: positive control (HeLa cells expressing HLA-C); the arrow indicates HLA-C.