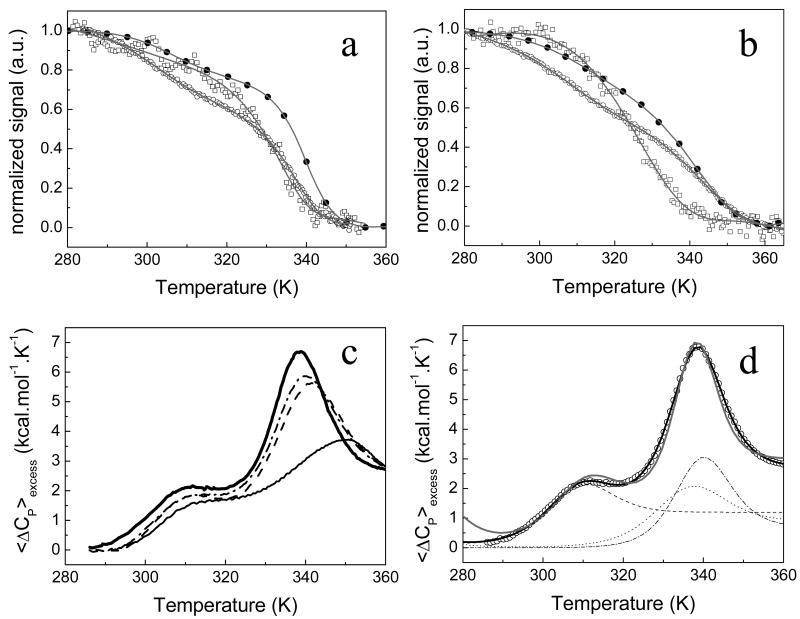
FIGURE 2.
(a) and (b) Thermal denaturation of H. pylori apoflavodoxin followed by spectroscopic techniques in EPPS 50mM, pH 9.0 and 50 mM MOPS, pH 7.0, respectively. Fluorescence data is represented as closed circles, far-UV CD as open circles and near-UV CD as open squares. The continuos gray lines represent the best global fit to a four-state model. (c) and (d) DSC of H. pylori apoflavodoxin. In figure (c) DSC curves of apoflavodoxin at different pH values: thin continuous line is pH 7.0, dashed line is pH 8.0, dash-dotted line, pH 8.5 and the thick continuous line, pH 9.0. Figure (d) shows the excess heat capacity change at pH 9.0 as a function of temperature. The experimental data (open circles) and the theoretical fit of the data to a three-state model (gray line) and the fit to a four-state model (black line) are shown. The contribution of each transition (the deconvolution) is also represented: the first transition as dash line, the second transition as dotted line and the third one as dash-dotted line.

