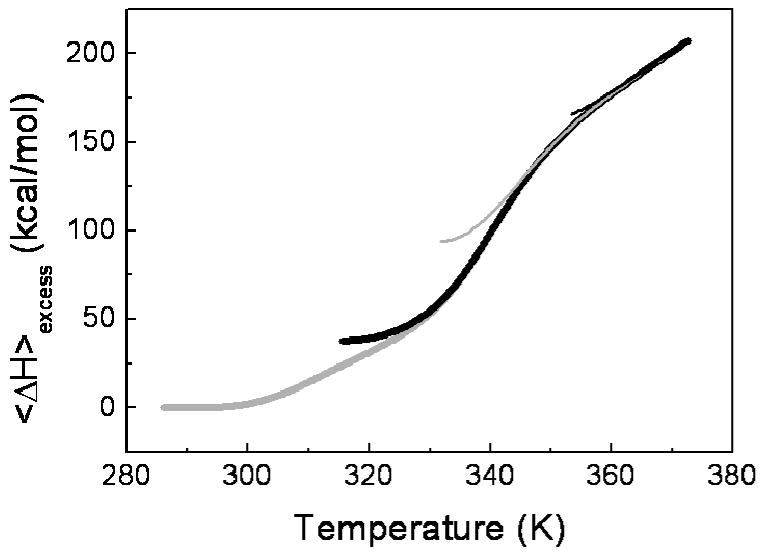
FIGURE 3.

Statistical Mechanical Deconvolution of the thermal denaturation of H. pylori apoflavodoxin in EPPS 50 mM pH 9.0, followed by differential scanning calorimetry. The grey thick line represents the enthalpy function obtained directly from the integration of the calorimetric experiment. The black thick line represents the excess enthalpy change after the contribution of the first transition is eliminated. The grey and black thin lines correspond to the excess enthalpy change after removing the contribution of the subsequent macroscopic states using the recursive method (see Materials and Methods), i.e., the first intermediate and the second intermediate, respectively.
