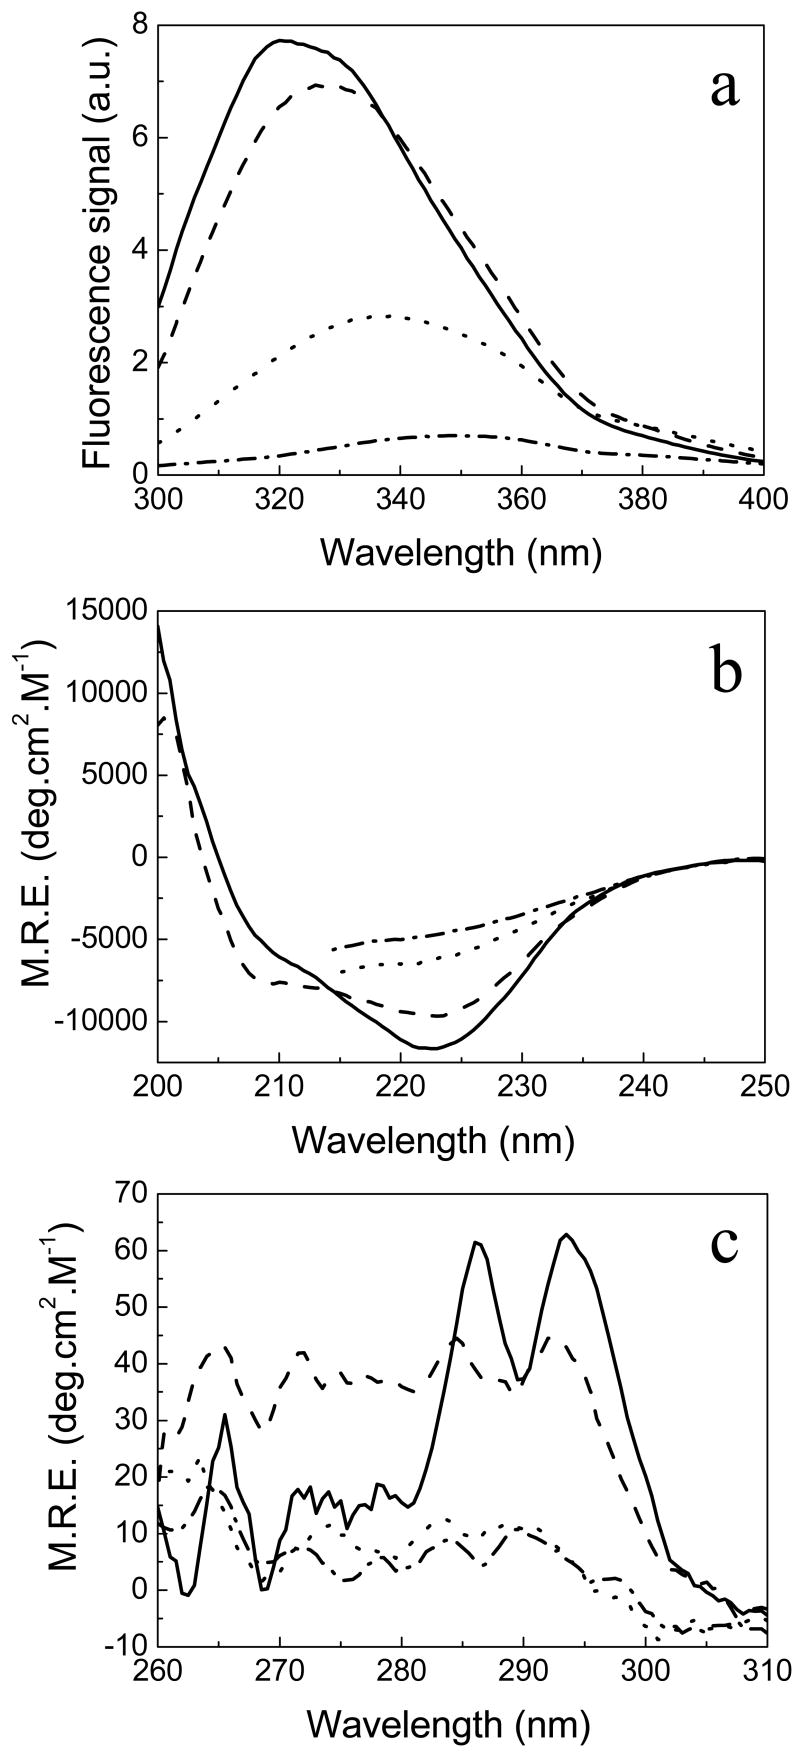
FIGURE 7.
Spectroscopic characterization of the four significantly populated states of H. pylori apoflavodoxin (sequential thermal unfolding model) by spectra deconvolution: native (continuous line), first thermal intermediate, I1 (dashed line), the second intermediate, I2 (dotted line) and the unfolded state (dash-dotted line). Fluorescence (a), far-UV CD (b), and near-UV CD (c) spectra.

