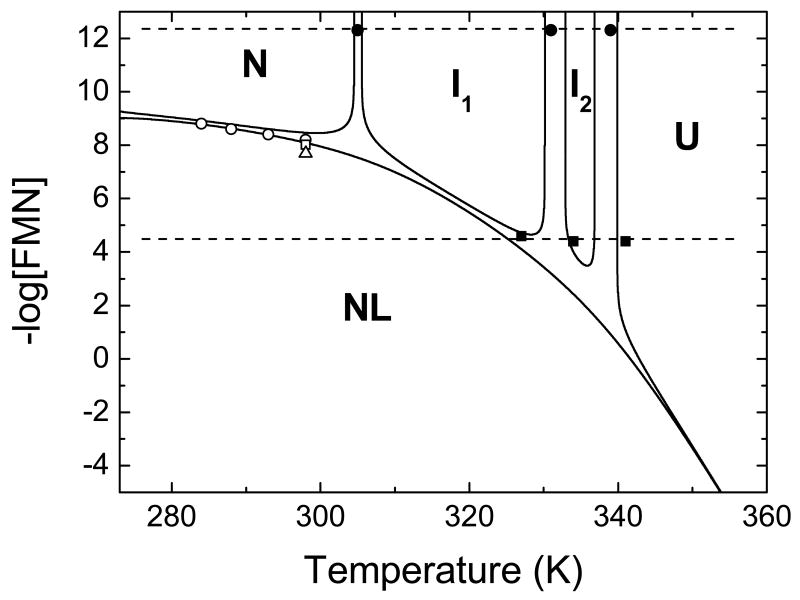
FIGURE 9.
Temperature-ligand concentration phase diagram for the coupling of the conformational equilibrium and the binding equilibrium in the flavodoxin-FMN system at pH 9.0. Continuous lines, engulfing regions where the specified conformation is dominant, are constructed as the geometric sites of the points at which a given species populates 50% of the total protein concentration, using the parameters determined for unfolding and binding at pH 9.0. The different species are represented by: N (native unliganded), NL (native liganded), I1 (first intermediate), I2 (second intermediate), and U (unfolded protein). The two dotted lines represent trajectories of typical temperature denaturations in the absence (top) and the presence (bottom) of FMN. Experimentally determined parameters are indicated with symbols: binding affinity estimated by spectroscopy (open circles), DSC (open square), and ITC (open triangle); unfolding transition temperatures in the absence (closed circles) and presence of FMN cofactor (closed squares).

