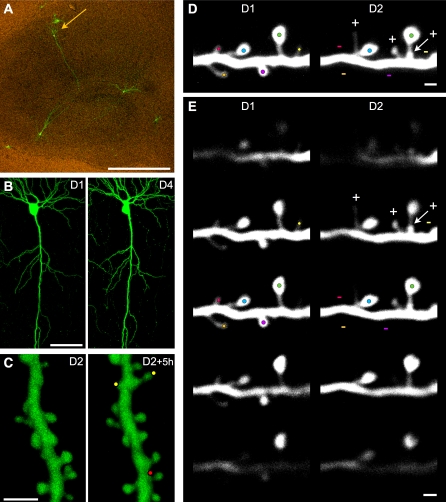
Figure 1. Illustration of the Experimental Approach.
(A) EGFP fluorescent CA1 pyramidal cell (arrow) in an 11 d in vitro organotypic hippocampal slice culture observed 3 d after transfection (scale bar: 100 μm).
(B) Low magnification view of a CA1 pyramidal cell imaged on the first (D1) and fourth day (D4) of observation (scale bar: 50 μm).
(C) 3D reconstructions of a dendritic segment imaged twice at 5-h intervals 24 h after LTP induction (see the axial rotation of the 3D reconstructed segments in Video S1). Note the appearance of two new protrusions (yellow dots) and disappearance of one (red dot) within this 5-h interval (scale bar: 2 μm).
(D) Example of turnover analyses of z-stacks projections of raw images at observation day 1 (D1) and day 2 (D2). Color dots are placed on protrusions, one color per protrusion to facilitate their identification. At D2, three new protrusions are identified by a plus sign (+) and four lost protrusions by a minus sign (−) (scale bar: 1 μm).
(E) Series of images from the z-stacks shown in (D) but at different z depths to illustrate the possibility to detect protrusions in the three dimensions. Color dots from (D) and + and − signs are reported on the z plan that is the most relevant for each protrusion (highest brightness). Note that the relative position of each protrusion along the z-axis is well conserved between observations (scale bar: 1 μm).

