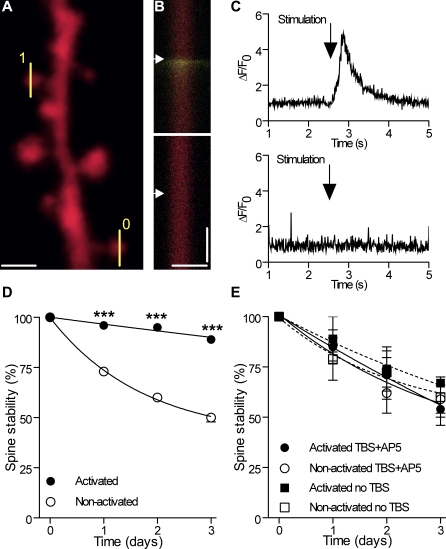
Figure 5. Differential Stabilization of Activated and Nonactivated Spines following Rhythmic Activity.
(A) Illustration of a dendritic segment with line scan analyses made on an activated (1) and a nonactivated (0) spine.
(B) Line scans showing the mRFP and Fluo-4 channels obtained by analysis of the activated and nonactivated spines (scale bars: 1 μm; 1 s, arrows: stimulation of Schaffer collaterals).
(C) Fluo-4 signals recorded in (B), expressed as ΔF/F0.
(D) Differential long-term stability of activated (filled circles) and nonactivated spines (open circles) following LTP induction (n = 10 cells/62 activated and 130 nonactivated spines).
(E) Same as in (D) but with TBS + 100 μM D-AP5 (n = 4 cells/36 activated [filled circles] and 44 nonactivated spines [open circles]).
***p < 0.001; two-way ANOVA with Bonferroni post-tests.

