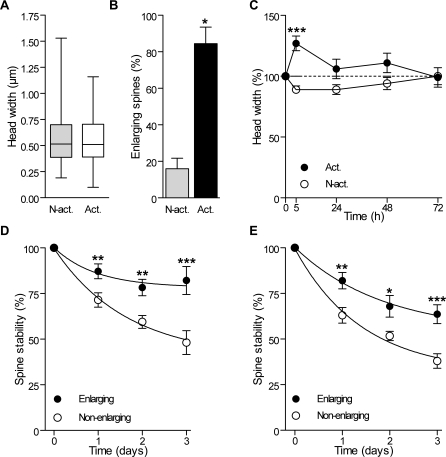
Figure 6. Differential Enlargement and Stability of Activated and Nonactivated Spines after Induction of Rhythmic Activity.
(A) Box plot distributions (min to max) of the head width of activated (Act; n = 98) and nonactivated spines (N-Act; n = 174) measured before TBS.
(B) Proportion of activated and nonactivated spines that exhibited an enlargement 5 h after TBS (n = 4 cells/16 activated and 63 nonactivated spines). Spines were defined as enlarging if their head diameter increased by more than 0.1 μm in 5 h.
(C) Changes in spine width of activated and nonactivated spines and expressed as percent of initial values (n = 4 cells/16 activated and 63 nonactivated spines).
(D) Differential stability of spines that enlarged (filled circles) or did not enlarge (open circles) 5 h after LTP induction (n = 11 cells, 75 enlarging and 179 nonenlarging spines).
(E) Differential stability of spines that enlarged (filled circles) or did not enlarge (open circles) 5 h after carbachol treatment (n = 4 cells/21 enlarging and 58 nonenlarging spines).
*p < 0.05, **p < 0.01, ***p < 0.001; Mann-Whitney U-test (B), two-way ANOVA with Bonferroni post-tests (C, D, and E).

