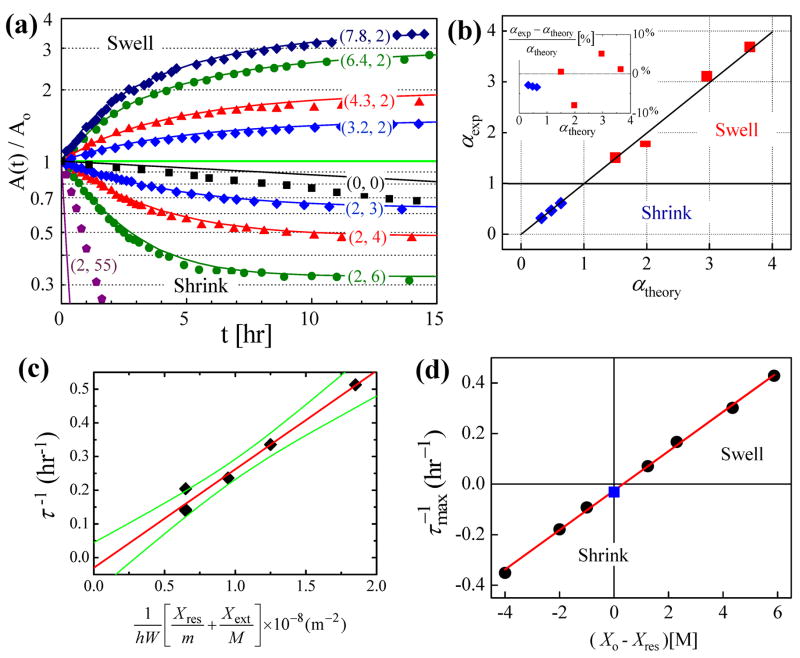
Figure 2.
(a) The relative areas of saline drops (A(t)/Ao) stored in wells as a function of time (t) after a change in reservoir salt concentration. The vertical axis is a logarithmic scale. The numbers next to each curve represent the initial salt concentration [M] of the drop and reservoir; (Xo, Xres). The solid lines are the theory using the same single adjustable parameter (P) for each curve. (b) The ratio of final to initial drop area for experiment vs. theory. The experimental values (αexp) are obtained by fitting the data of (a) to Equation (1). The theoretical values (αtheory) are obtained using Equation (2) and the known experimental parameters. (c) The rate of change of the τ−1, is plotted vs. which equation (3) predicts is a line passing through the origin with slope P = k D. The experimental values of τ−1 are obtained by fitting the data of (a) to Equation (1). The green lines mark 90% confidence levels. (d) The initial (maximal) rate of change of the relative area, , given in equation 4 as a function of the difference between the initial salt concentration of the drop and reservoir; Xo − Xres.

