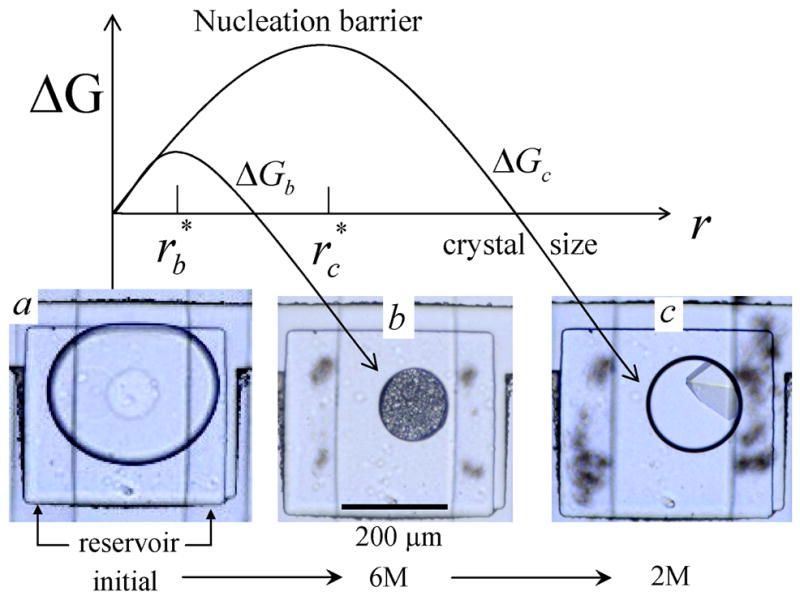
Figure 6.

The free energy of crystal formation ΔG as a function of crystal radius r. ΔGb and ΔGc correspond to high and low Δμ, respectively. (a) Initially the protein solution stored in the well is a stable single phase and ΔG > 0 for all r. (b) The chemical potential reservoir (Fig 1), located below the well, is filled with 6M NaCl causing water to osmotically flow out of the drop, raising Δμ and creating a free energy, ΔGb, with a small nucleation barrier leading to production of many small crystals of minimum size . (c) Next, the reservoir is filled with 2M NaCl, causing water to flow back into the drop, lowering Δμ and raising the nucleation barrier, ΔGc. Only crystals larger than grow while smaller crystals melt. This transforms the small precipitates in (b) into a single large crystal, a process known as Oswald ripening. Five times fewer crystals were observed when the protein drop in (a) was quenched directly to final condition (c), indicating the importance of controlling the kinetic pathway for protein crystallization. The protein solution was a mixture of 20 mg/ml lysozyme and 10 %(w/w) poly(ethylene) glycol (PEG) of molecular weight 8000 g/mol dissolved in 0.2 M sodium acetate trihydrate and 0.1 M sodium cacodylate at pH 6.5.
