
Figure 6.
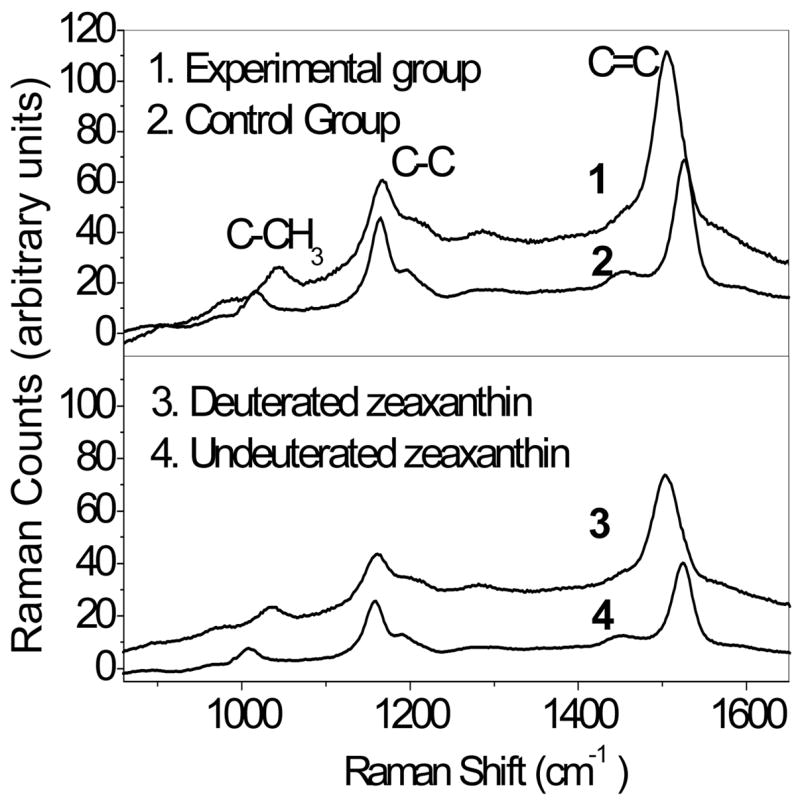
Normalized resonance Raman spectra recorded from living quail eyes. The upper panel shows a spectrum from a bird fed deuterated zeaxanthin for 12 weeks (1) in comparison to a bird fed an undeuterated control diet (2). The lower panel shows spectra of deuterated (3) and undeuterated (4) standards. Note the 20 cm−1 displacement of the C=C stretch peak with deuteration in the standards and in the living eye. See Table 3 for quantitative analysis of the C=C peak height in comparison to HPLC analysis.