
Figure 1. Heat-map showing the number of mismatches between different hierarchically clustered mouse homeodomains (left) and their closest BLAST or BLAT hit in other species as indicated (right).
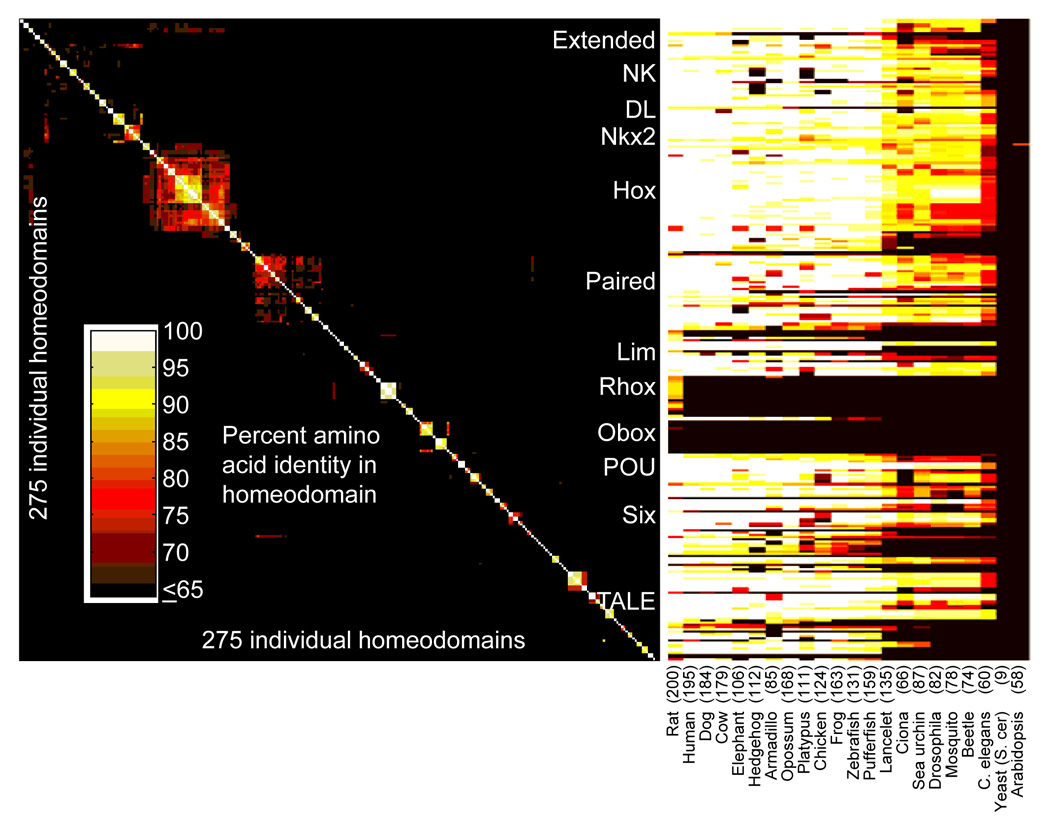
The number of distinct homeodomain-containing protein counterparts in other species is given, based on the number of different gene sequences represented (i.e., isoforms are counted as a single entity). Major homeodomain families are indicated.