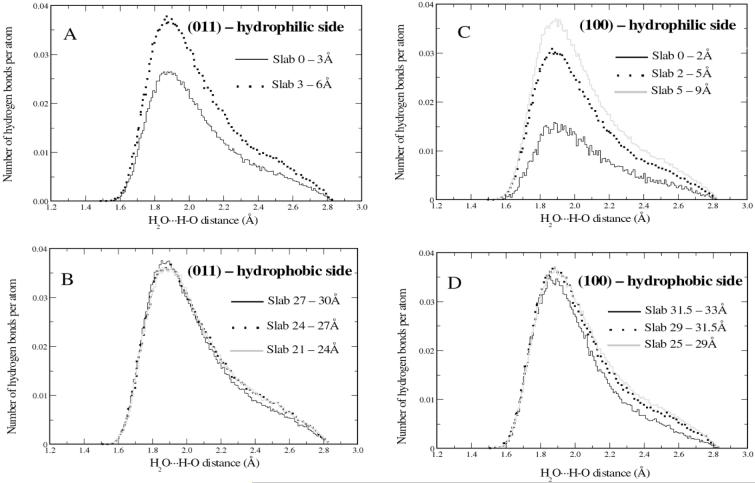
Figure 10.
Distribution of water-water H-bond separations H2O···H-OH for waters adsorbed on quartz (011) (A and B) and quartz (100) (C and D). Each plot corresponds to a different layer, measured from the quartz surfaces. The top and bottom drawings are for water adsorbed on the hydrophilic and hydrophobic sides, respectively. The plots are normalized to the total number of waters in each slab.

