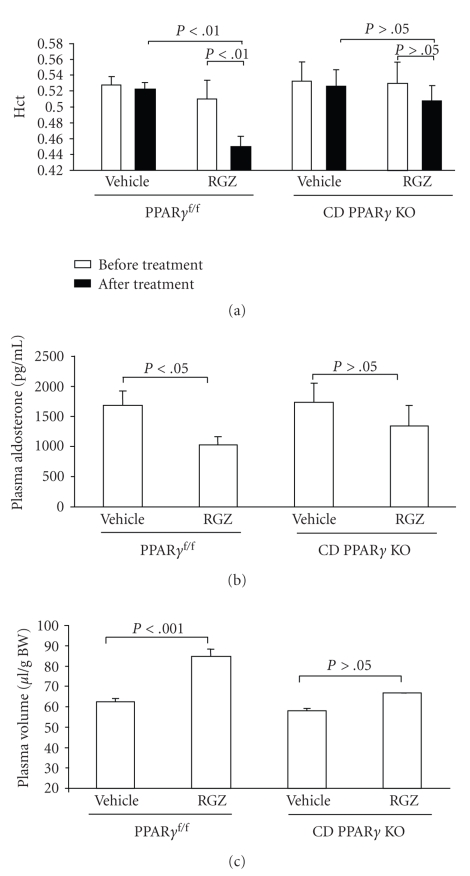
Figure 2.
Changes in plasma volume in PPARγ f/f and CD PPARγ knockout mice following rosiglitazone (RGZ) treatment (adapted from [28]). (a) Hematocrit (Hct) in PPARγ f/f and CD PPARγ knockout mice before and after RGZ treatment. (b) Plasma aldosterone levels in PPARγ f/f and CD PPARγ knockout mice following RGZ treatment. (c) Determination of plasma volume in PPARγ f/f and CD PPARγ KO mice by the Evans blue (EB) dye technique.

