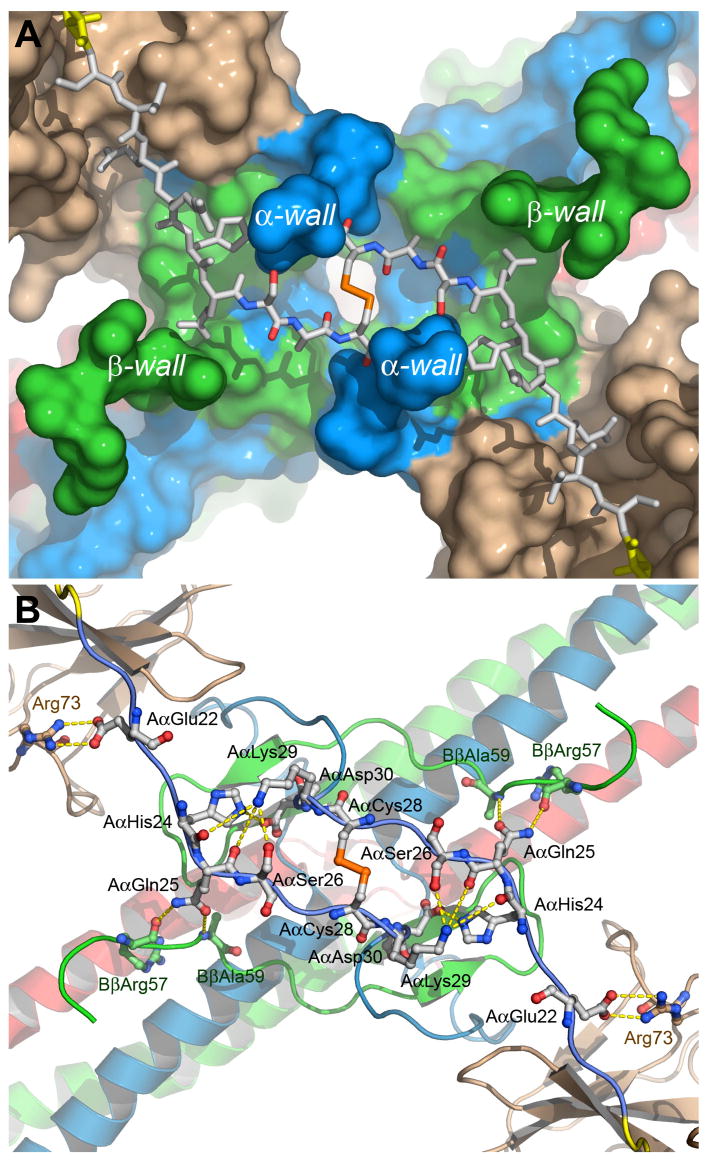
Fig. 3. Topology of the molecular surface around the modeled segments of the Aα chains in the thrombin-Eht complex (A) and potential contacts between these segments and the complex (B).
Panel a shows the solvent accessible surface of the thrombin-Eht complex with the Aα20-28 segments (shown by sticks) located in the groove between the wall-like structures denoted as α- and β-walls. The color scheme is the same as in Fig. 2, namely, the Aα, Bβ and γ chains of Eht are in blue, green and red, respectively, thrombin molecules are in beige; the Aα20-25 segments are in white, AαArg19 of the thrombin-bound fpA variant is in yellow, and the Aα26-28 segment are colored by atom types. Panel B shows a ribbon diagram of the thrombin-Eht complex in the same projection as that in panel A with a potential set of polar contacts between individual residues of the Aα22-30 segments and the bulk of the complex. The residues involved in contact formation are represented by ball-and-sticks and colored according to their atom types; interatomic contacts are shown by dashed lines.

