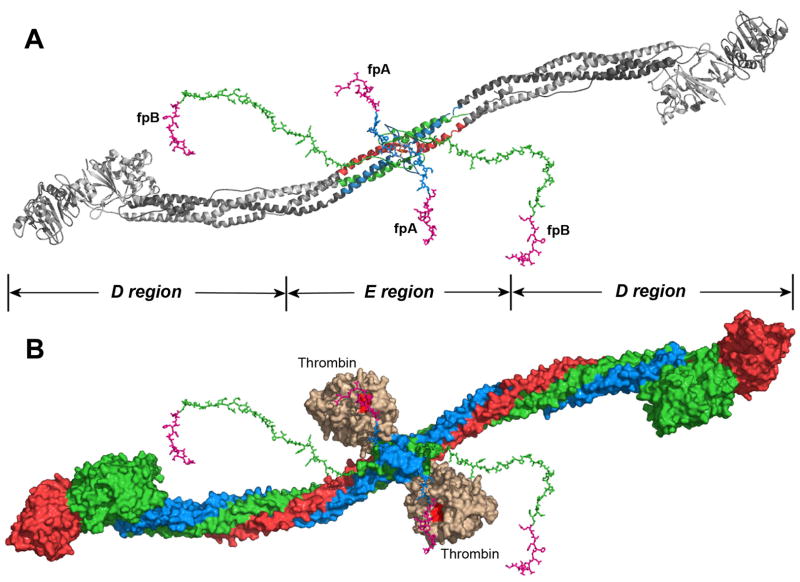
Fig. 4. Putative location of the NH2-terminal portions of the Aα and Bβ chains in fibrinogen.
Panels A and B represent the ribbon diagram of fibrinogen and solvent accessible surface of a complex of fibrinogen with thrombin, respectively. The newly modeled portions of the Aα and Bβ chains are presented in both panels by sticks. The model in panel A was generated by superimposing the chicken fibrinogen structure (26), which was used as a template, with that of the Eht fragment (16), followed by replacement of the overlapping regions with those from the latter. In the model, the Aα, Bβ and γ chains derived from Eht are shown in blue, green and red, respectively, those derived from chicken fibrinogen are in gray. The complete NH2-terminal portions of the Aα and Bβ chains including fpA and fpB (both shown in magenta) were modeled as described in the text. Panel B represents the same fibrinogen molecule in complex with two thrombin molecules that were docked to its central region in the way that they appear in the structure of the thrombin-Eht complex (Fig. 2). The complete Aα, Bβ and γ chains are in blue, green and red, respectively. Thrombin molecules are in beige, their catalytic triad is highlighted in red. The vertical lines denote approximate boundaries between the fibrinogen D and E regions.

