
Fig. 6. Putative arrangement of the D and E regions and location of the NH2-terminal portions of the Bβ chains in a protofibril.
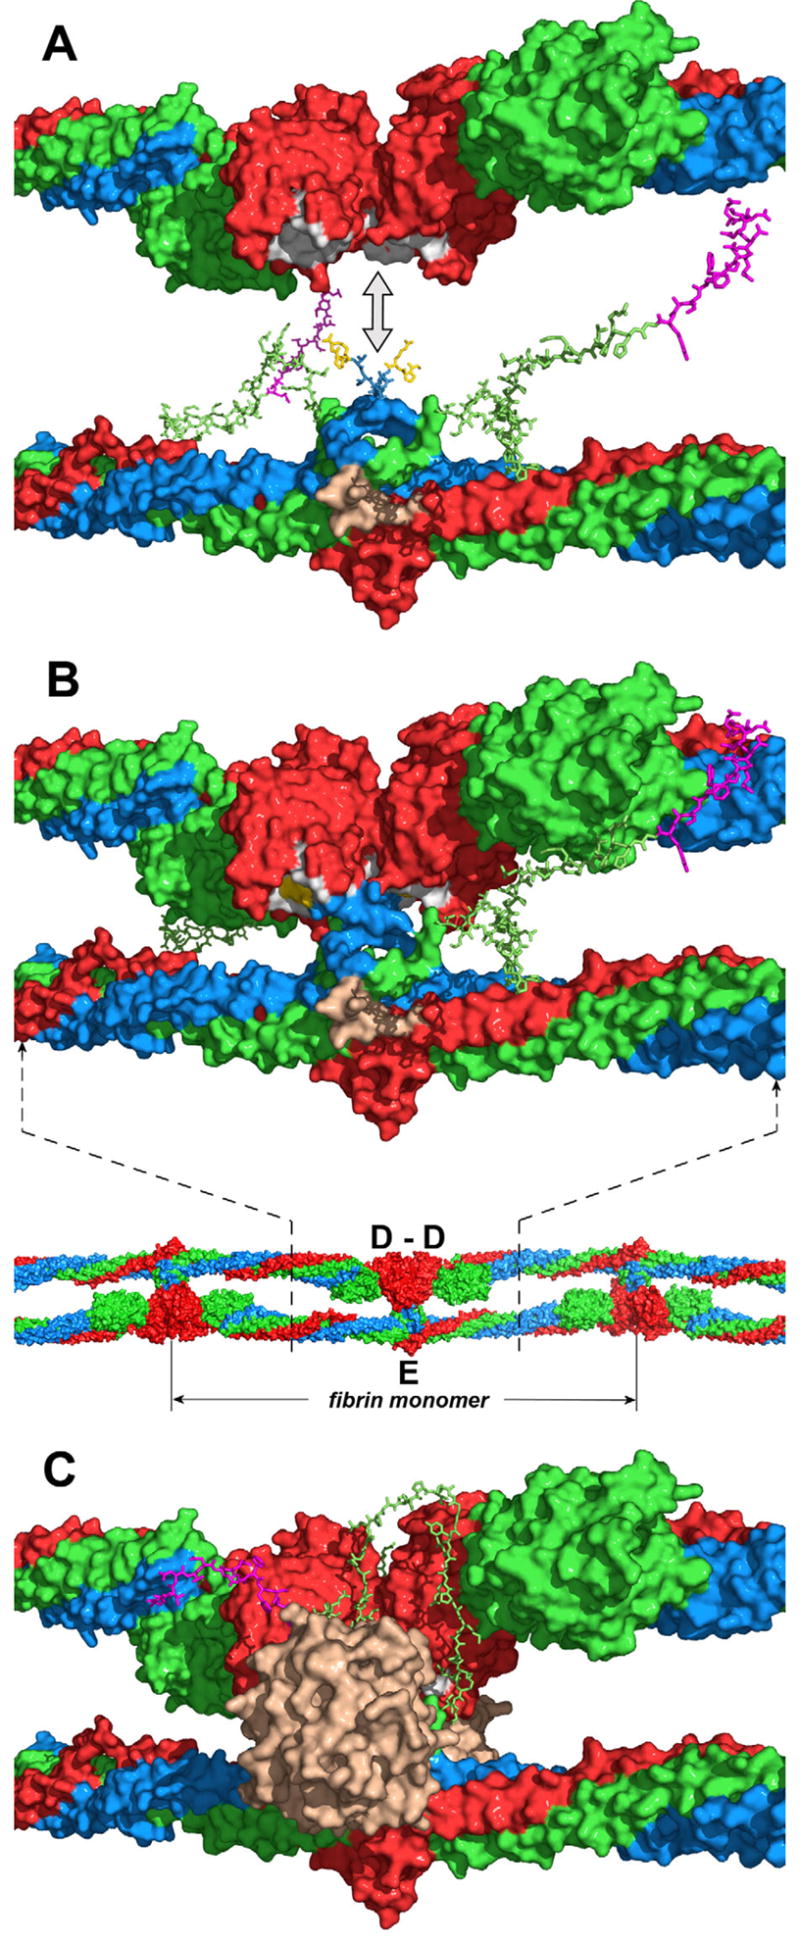
Panel A represents docking of the D dimer (top diagram) into the E region (bottom diagram) in the direction shown by the double-headed arrow to model the D:E:D interaction in a protofibril presented in panel B (top diagram). The location of the D and E regions in a protofibril is shown in the bottom diagram of panel B by dashed lines; the individual fibrin monomer in the protofibril is also denoted. The D dimer and E region are shown with solvent accessible surfaces; the randomly generated Aα17-23 and Bβ1-53 segments are represented by sticks. The Aα, Bβ and γ chains are shown in blue, green and red, respectively, fpBs in magenta, polymerization knobs “A” of the E region (Aα chain residues Gly17-Pro18-Arg19) in yellow, complementary holes “a” of the D regions in white, and the thrombin-binding site in the E region in beige. Note that although the NH2-terminal portions of the Bβ chains in panel B are shown in the same conformation as in panel A, in a protofibril they should interact with the newly formed D-D “wall” (see text). Panel C shows the same model as panel B with thrombin (in beige) bound to the E region and the NH2-terminal portion of the Bβ chain bound to the D-D “wall”. Although the exact conformation of this portion and the mode of its interaction with D-D are yet to be identified, in the model it is arranged on the D-D “wall” in a way that would facilitate its interaction with the active site cleft of bound thrombin (see text).