
Figure 2.
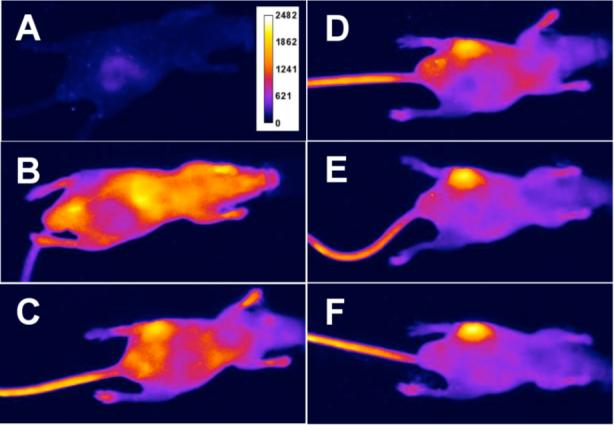
Optical images of a mouse with a S. aureus infection in the left rear thigh muscle. Images were acquired before (A), and immediately following (B), intravenous injection of probe 1, and at 6 h (C), 12 h (D), 18 h (E), and 21 h (F). Scale represents the same relative fluorescence intensity for all six images in arbitrary units.