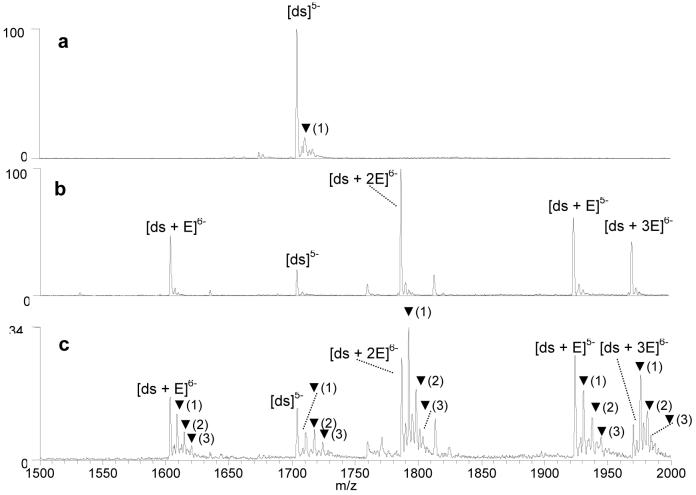
Figure 4.
ESI-mass spectra showing solutions containing the duplex d(GCGGATATATGGCG/CGCCATATATCCGC) (a) after 20 min, reaction with KMnO4, (b) with echinomycin (E), prior to reaction with KMnO4, and (c) with echinomycin (E), after 20 min. reaction with KMnO4. Ions containing oxidized thymines are labeled with ▼, with the number in parenthesis indicating the number of oxidation adducts.

