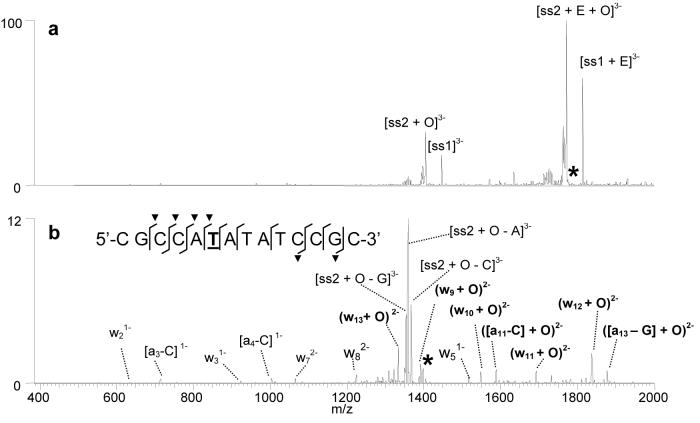
Figure 6.
ESI-MS3 experiments for [ds + 2E + O]6− containing d(GCGGATATATGGCG/CGCCATATATCCGC) and echinomycin (E): (a) CAD spectrum of the initial [ds + 2E + O]6− complex and (b) MS3 spectrum of the [ss2 + O]3− product ion. “O” is indicative of an oxidation adduct. The sequence structure in Figure 5b summarizes the sequence coverage. The fragments containing an oxidation adduct are labeled with a “▼” symbol. The thymine that was determined to be oxidized is underlined in the sequence shown in Figure 2b. The d(GCGGATATATGGCG) single strand is abbreviated as ss1, while d(CGCCATATATCCGC) is ss2. The selected precursor ion is labelled with an asterisk.

