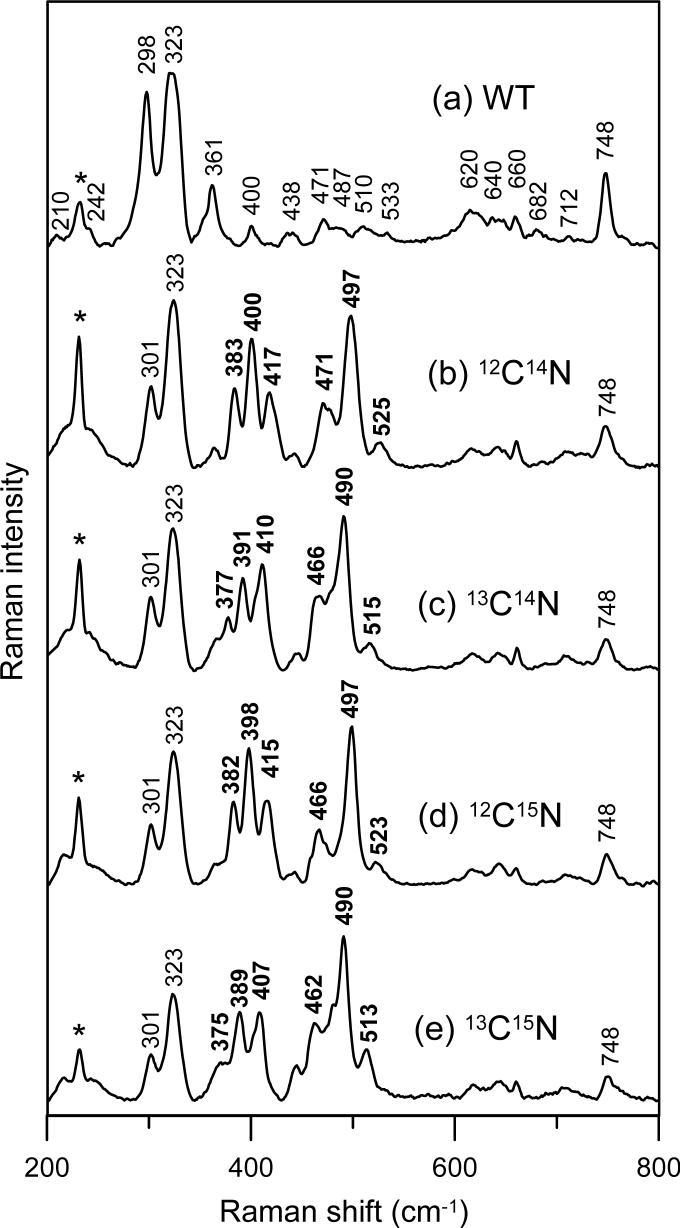
Figure 1.
Resonance Raman spectra of hexachloroiridate-oxidized P. furiosus 1Fe-SOR: (a) without KCN; (b) with natural abundance KCN; (c) with K13CN; (d) with KC15N; (e) with K13C15N. Spectra were recorded using 647-nm excitation on samples maintained as frozen droplets at 17 K. Each sample was ∼4 mM in SOR and 120 mM in potassium cyanide and was in 100 mM TAPS buffer, pH 8.5. Spectra were recorded using 6 cm−1 resolution by photon counting for 1 sec every 1 cm−1 and each spectrum is the sum of 50 scans. The asterisk indicates a lattice mode of ice and the frequencies of the cyanide isotope-sensitive bands are in bold type.

