
Figure 3.
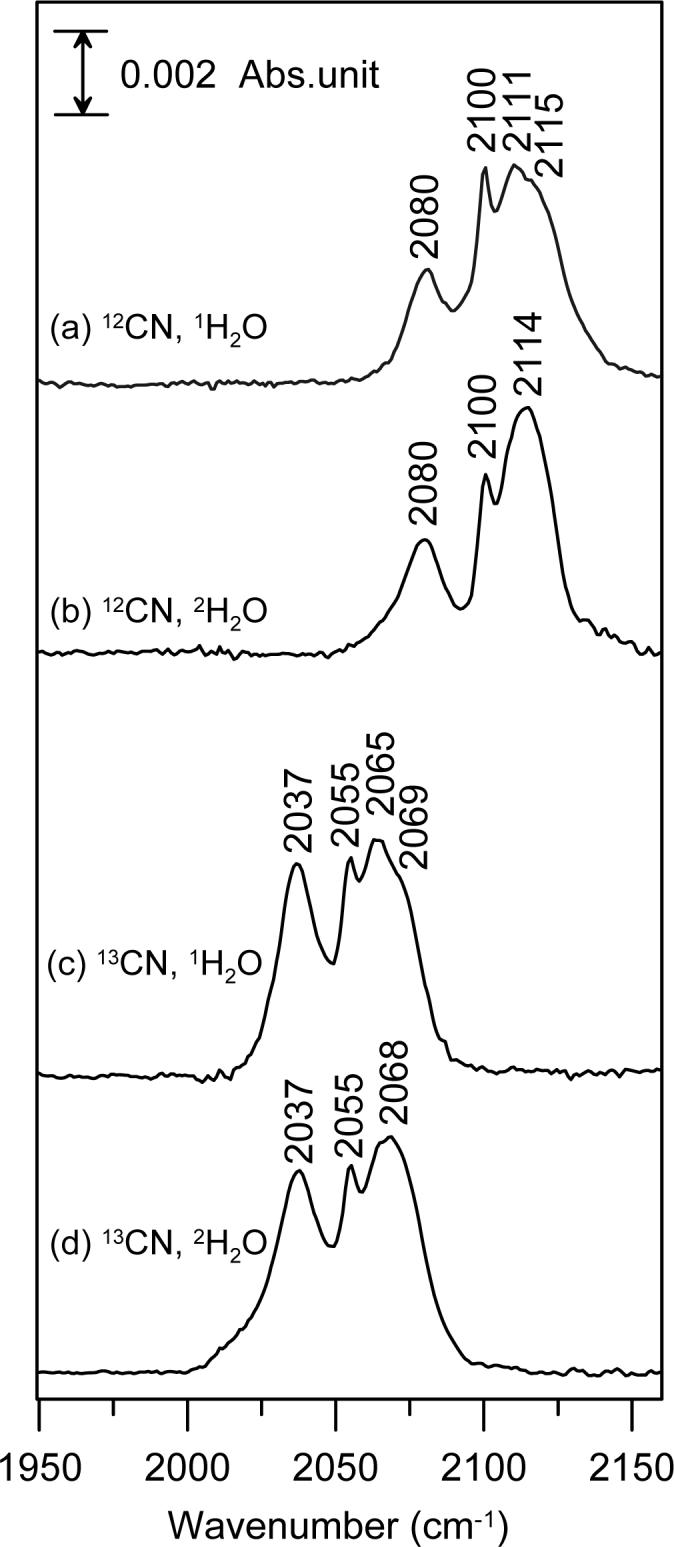
FTIR spectra of cyanide-bound, hexachloroiridate-oxidized P. furiosus 1Fe-SOR in the C–N stretching region: (a) natural abundance KCN in 1H2O buffer; (b) natural abundance KCN in 2H2O buffer; (c) K13CN in 1H2O buffer; (d) K13CN in 2H2O buffer. Each sample was ∼4 mM in SOR and 120 mM potassium cyanide and was in 100 mM 1H2O or 2H2O TAPS buffer, pH 8.5. Spectra were collected in the mid-IR region (400 − 4000 cm−1) at room temperature with a resolution of 2 cm−1 and are represent the average of 256 scans.