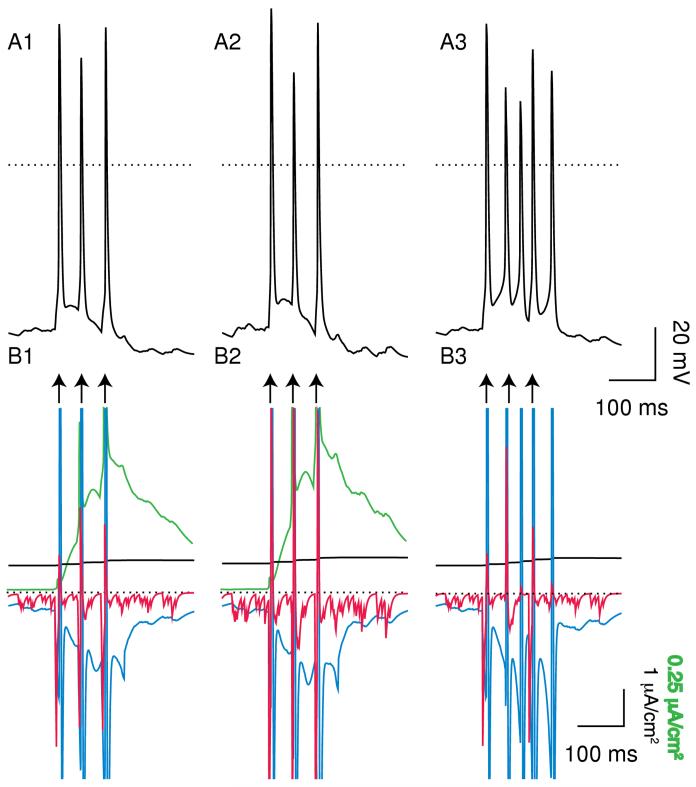
Figure 11.
Effect of increasing the GABAA conductance. A. Each curve represents one of 6 representative average values of PNMDA in panel A at 21 values of gGABA,A,s. The legend in A1 gives each value of PNMDA×10-6 cm/s for both A1 and A2. A1. Average number of spikes per burst decreases as gGABA,A,s is increased. A2. The total number of bursts usually but not always decreases as gGABA,A,s is increased (see text). B. Average P = 2.028×10⁻⁶ cm/s (IEI = 1.1898 ms) and gNMDA GABA,A,s= 1700 μS/cm2. The dotted line indicates 0 mV. B1: control. B2: SK block. At this high level of gGABA,A,s, SK block results in three additional spikes in five seconds, two of which occur in bursts. The effect is much less dramatic than that at lower values of gGABA,A,s.

