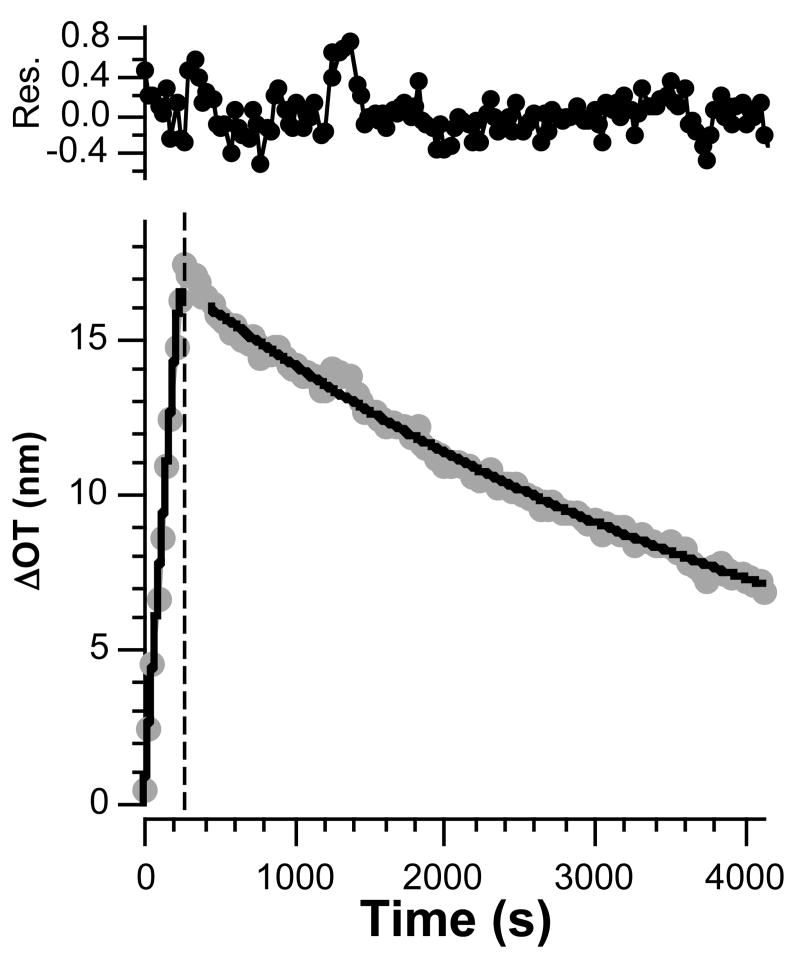
Figure 6.
Association (dots, left of dashed line) and dissociation (dots, right of dashed line) curves and corresponding fit to the time-dependent equations 6 and 7 (solid lines) for a protein A-coated porous SiO2 surface dosed with 171 nM human IgG for a short period of time (4 min). Residuals represent the difference between the fit line and the data. The initial 180 s of dissociation data were not used in the fit, to account for clearing of the tubing and chamber of the flow cell upon switching from IgG to buffer solution.

