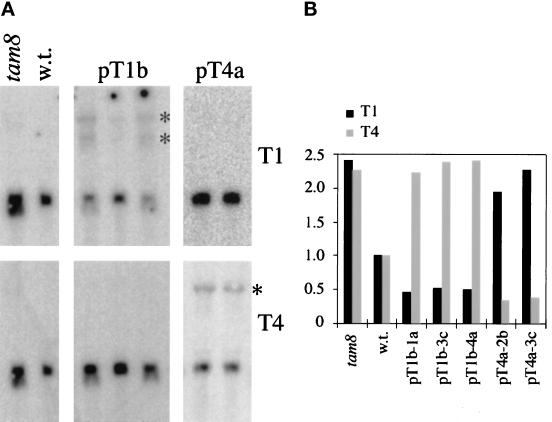
Figure 6.
Northern blot analysis of pT1b and pT4a transformants. (a) Total RNA was prepared from tam8 and wild-type cells (left), three clones of pT1b-transformed cells (middle), and two clones of pT4a-transformed cells (right). The blots were sequentially hybridized with the T1-specific probe (top) and with the T4-specific probe (bottom). Asterisks denote aberrantly migrating species that hybridized with a pUC18 vector-specific probe. (b) Histogram of the steady-state levels of T1 and T4 mRNAs in the various clones was established by quantification of the Northern blots shown in a, using hybridization to an ICL1-specific probe to normalize for the amount of total RNA in each sample.

