
Figure 4.


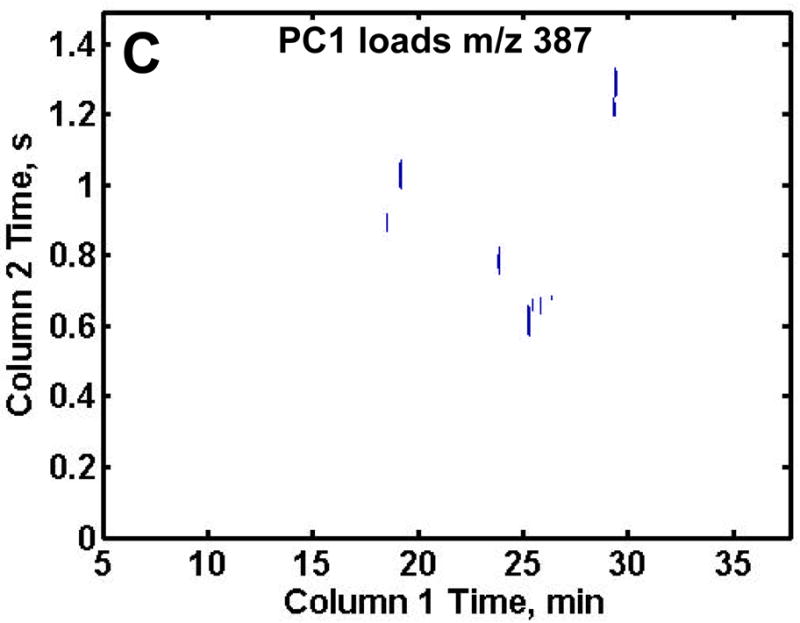
Resulting PC1 loadings plot after submission of all 70 chromatograms to PCA. The thresholds were empirically set to include only metabolites and not reagent artifacts, see text for values. PC1 loadings plot for (A) m/z 73, (B) m/z 205 and (C) m/z 387. Fifteen differentiating compounds were found at m/z 73 (A). Mass channel 205, (B) obtained an additional three metabolites and m/z 387 (C) obtained nine chromatographic peaks not found at m/z 73.