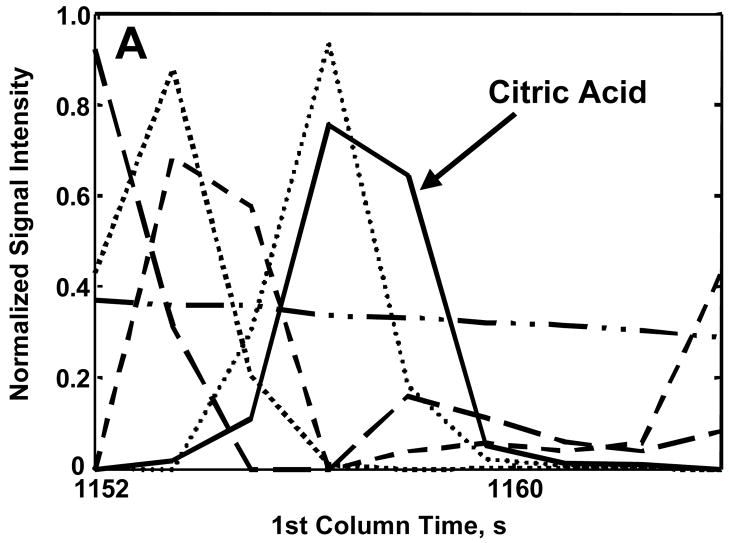
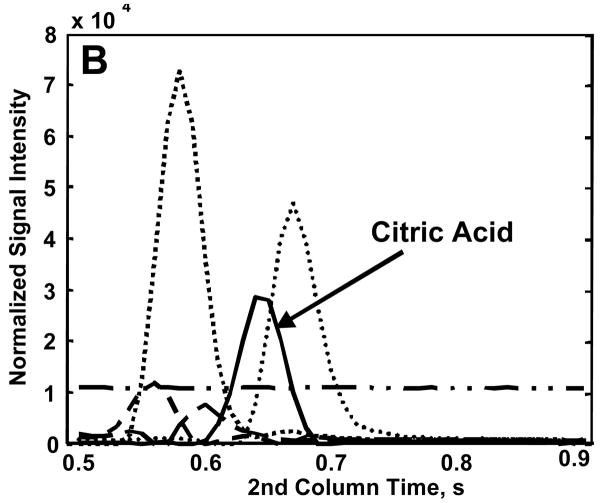
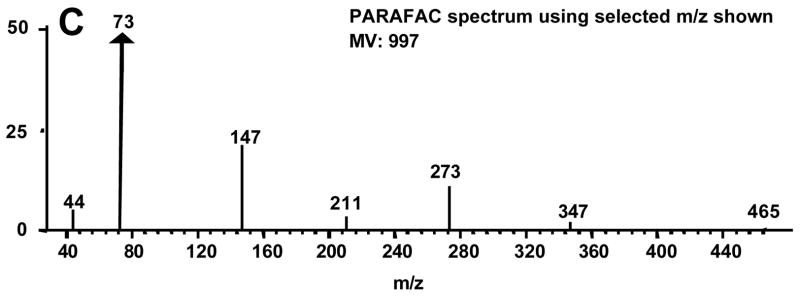
Figure 6.
Demonstration of using selective mass channels in PARAFAC for quantification. Using only the 7 mass channels labeled, the pure component peak profiles for citric acid 4TMS (solid lines) on column 1 (A), and column 2 (B) was separated from five overlapping interferents (symbolized by the broken and/or dotted lines). (C) The MV and resulting mass spectrum using the selected fragments is shown. The ratio of the fragment intensities is comparable to those in the library spectrum. The protocol for choosing these 7 mass channels is described in the text.


