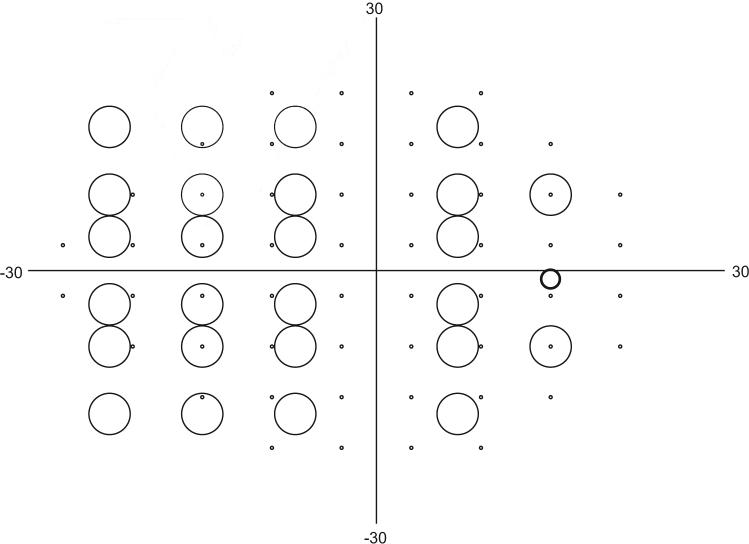
Figure 1.
Map of test locations in CAP and CSP in degrees of visual angle. Small circles: 54 locations tested with CAP; large circles: 26 locations tested with CSP. Circles show relative diameters of the stimuli. Medium circle: average location of the blind spot; patient fixation was monitored by presenting a Gabor stimulus at 100% contrast with a diameter of ∼2°.

