
Figure 5.
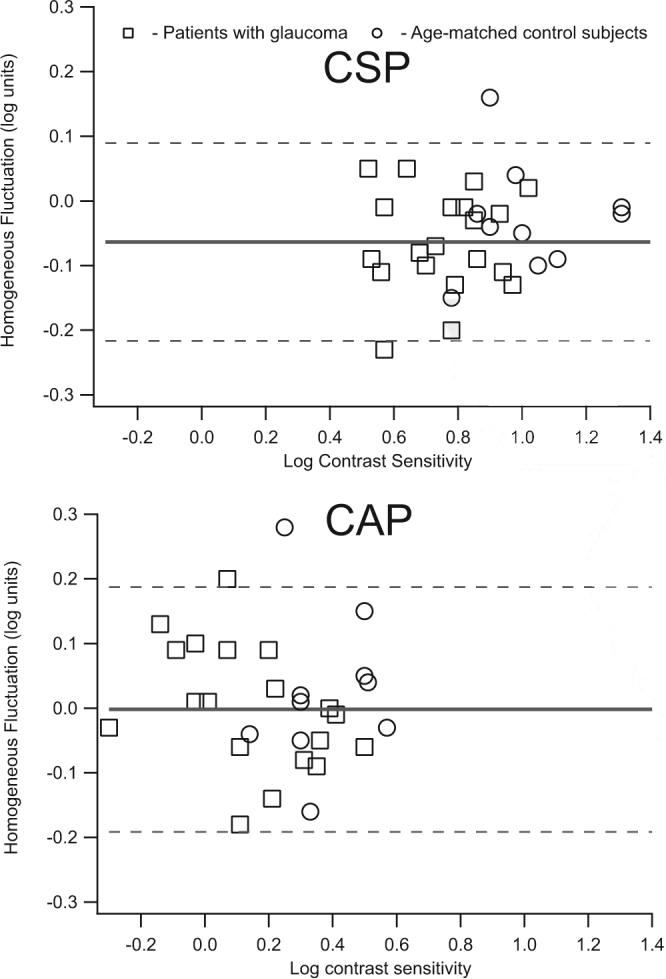
Homogeneous fluctuation for patients with glaucoma and age-similar control subjects as a function of mean contrast sensitivity for each subject. Top: data obtained from CSP with Gabor patches with six-reversal staircases; bottom: data obtained from CAP with the SITA-Standard algorithm. Dashed lines: 95% confidence limits for homogeneous fluctuation; these were not significantly different for CSP versus CAP (F = 1.53, P = 0.37).