Figure 8.

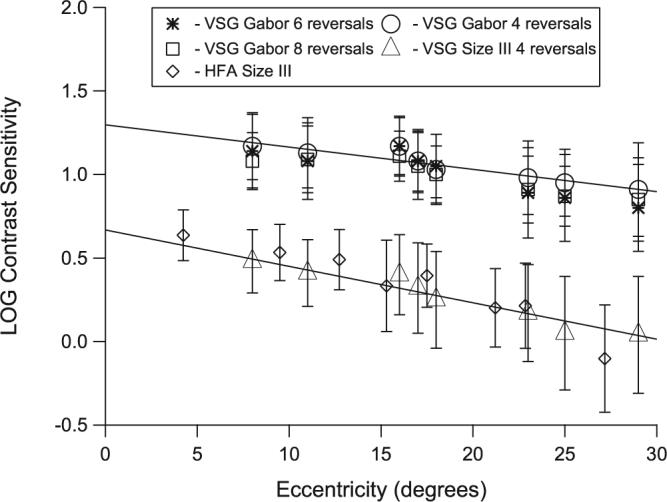
Mean sensitivity as a function of eccentricity in both control groups (younger group: four and eight reversals; older group: six reversals and HFA). Error bars represent ±1 SD for the younger control group.

Mean sensitivity as a function of eccentricity in both control groups (younger group: four and eight reversals; older group: six reversals and HFA). Error bars represent ±1 SD for the younger control group.