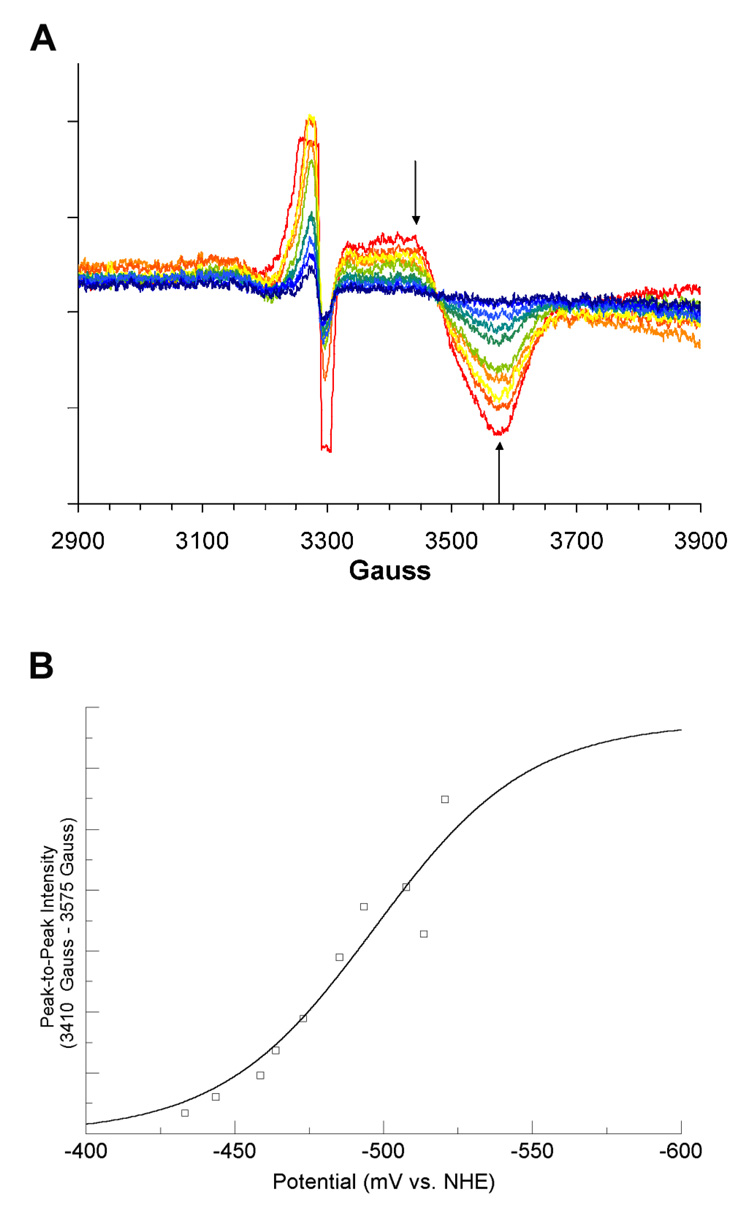
Figure 3. Titration of the [4Fe–4S]1+ Cluster in the Presence of azaSAM.
(A) 10 K EPR spectra from coulometric titration. Arrows shown are the two magnetic field values used for peak-to-peak intensity determinations. Spectra shown are computed averages of four 2 minute scans with time constant of 0.3 sec. Spectra were recorded at 9.256 GHz, with a modulation amplitude of 16 Gauss, 1mW power, and gain of 8000. (B) Potential vs. peak-to-peak intensity. The best-fit curve of the data to Equation 1 is shown in blue. Signal intensities were normalized for protein concentrations by means of a BCA protein assay (see text).

