
Fig. 4.
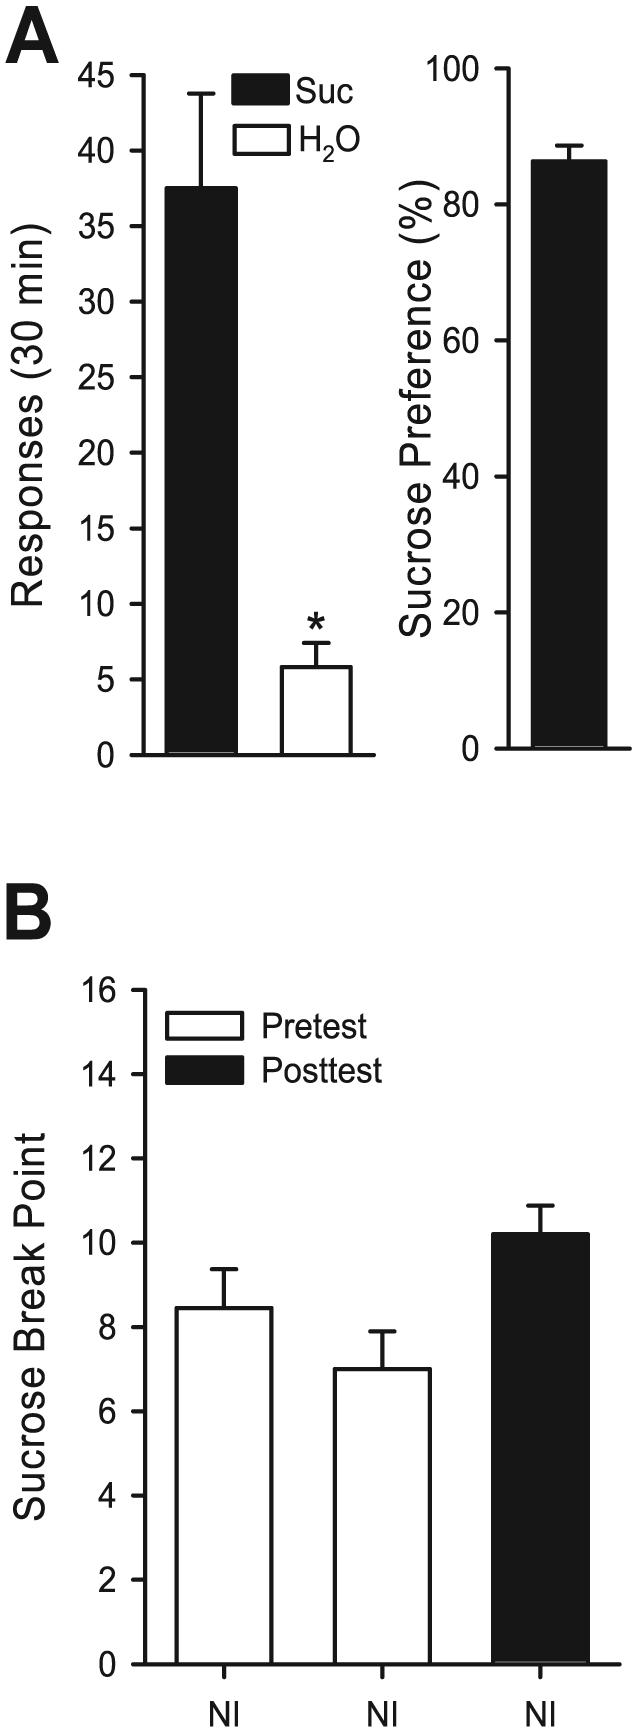
Panel (A) Left Panel: Mean (±SEM) responses on the sucrose (Suc, 0.4% w/v) and water (H2O) levers during the 30-minute baseline sessions. Middle Panel: Mean (±SEM) sucrose preference in percent (i.e., sucrose responses /(sucrose + water responses × 100)). All the mean (±SEM) values represent the average of 5 consecutive sucrose self-administration sessions before the start of antagonist testing. Panel (B): Mean (±SEM) sucrose (0.4% w/v) break point after repeated testing after no injection. Filled bar represents the sucrose break point after the testing of mGluR antagonists on sucrose progressive ratio 1 and locomotor assessments. *Indicates significant difference from sucrose (Paired t-test, p < 0.05).